Dogecoin (DOGE/USD) Is Determined to Meet the $0.0960 Price Target
Estimated Reading Time: 2 minutes
Don’t invest unless you’re prepared to lose all the money you invest. This is a high-risk investment and you are unlikely to be protected if something goes wrong. Take 2 minutes to learn more
It was the target of the Dogecoin buyers in the previous daily session to beat the $0.0960 price target, but unfortunately, bearish sentiment grew stronger after the market hit the $0.0944 price level and the market turned back. The previous session closed at $0.0881. That same price became the new support level. It has also formed the basis for today’s bull market.
Dogecoin/USD Price Statistics
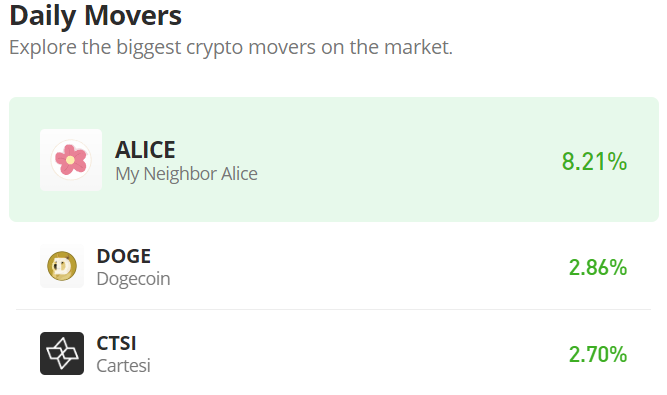
- DOGE/USD Price Now: $0.0921
- DOGE/USD Market Cap: $12,784,833,810
- DOGE/USD Circulating Supply:139,014,976,384 DOGE
- DOGE/USD Total Supply: 139,014,976,384
- DOGE/USD CoinMarketCap Ranking: #8
Key Levels
- Resistance: $0.100, $0.110, and $0.120
- Support: $0.800, $0.750, and $0.700
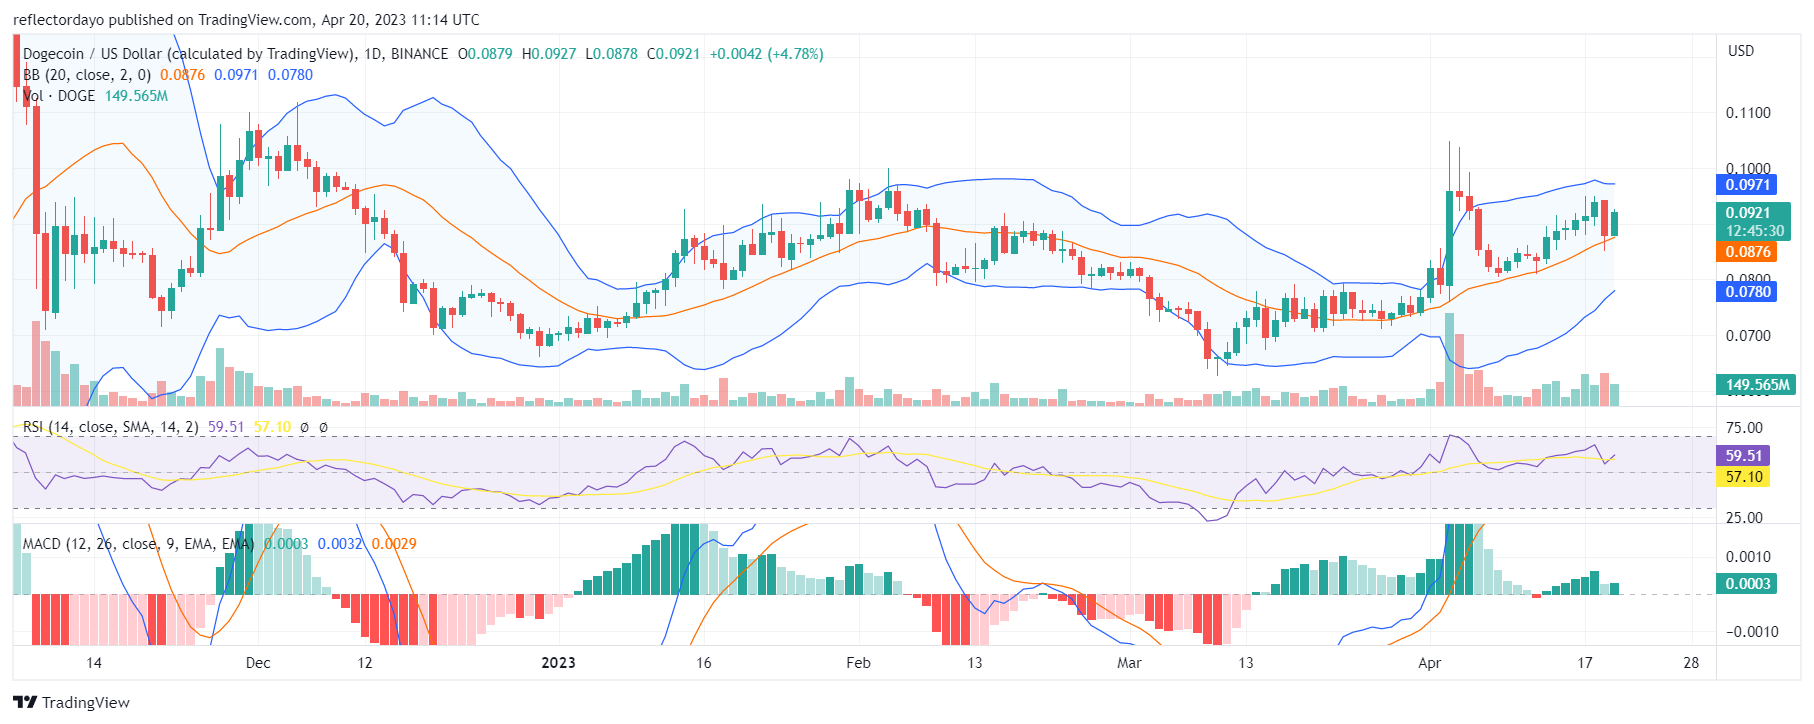
Price Prediction for Dogecoin: The Indicators’ Point of View
The $0.0960 price level was formed in early April, and the bull market is on its trail. However, the market has to deal with the supply level that was formed in the previous daily session. This should be a piece of cake as, according to the Relative Strength Index (RSI), the bullish momentum has risen to around level 59. But according to the Bollinger Bands indicator, we noticed the upper standard deviation curve was responding to the growing bearish sentiment among the traders due to the recent excitement in the market. The lower standard deviation curve and the 20-day moving average support a bullish sentiment, while the upper standard deviation curve moves in contrast to the other pointers. This is a testament to the high volatility in the market.
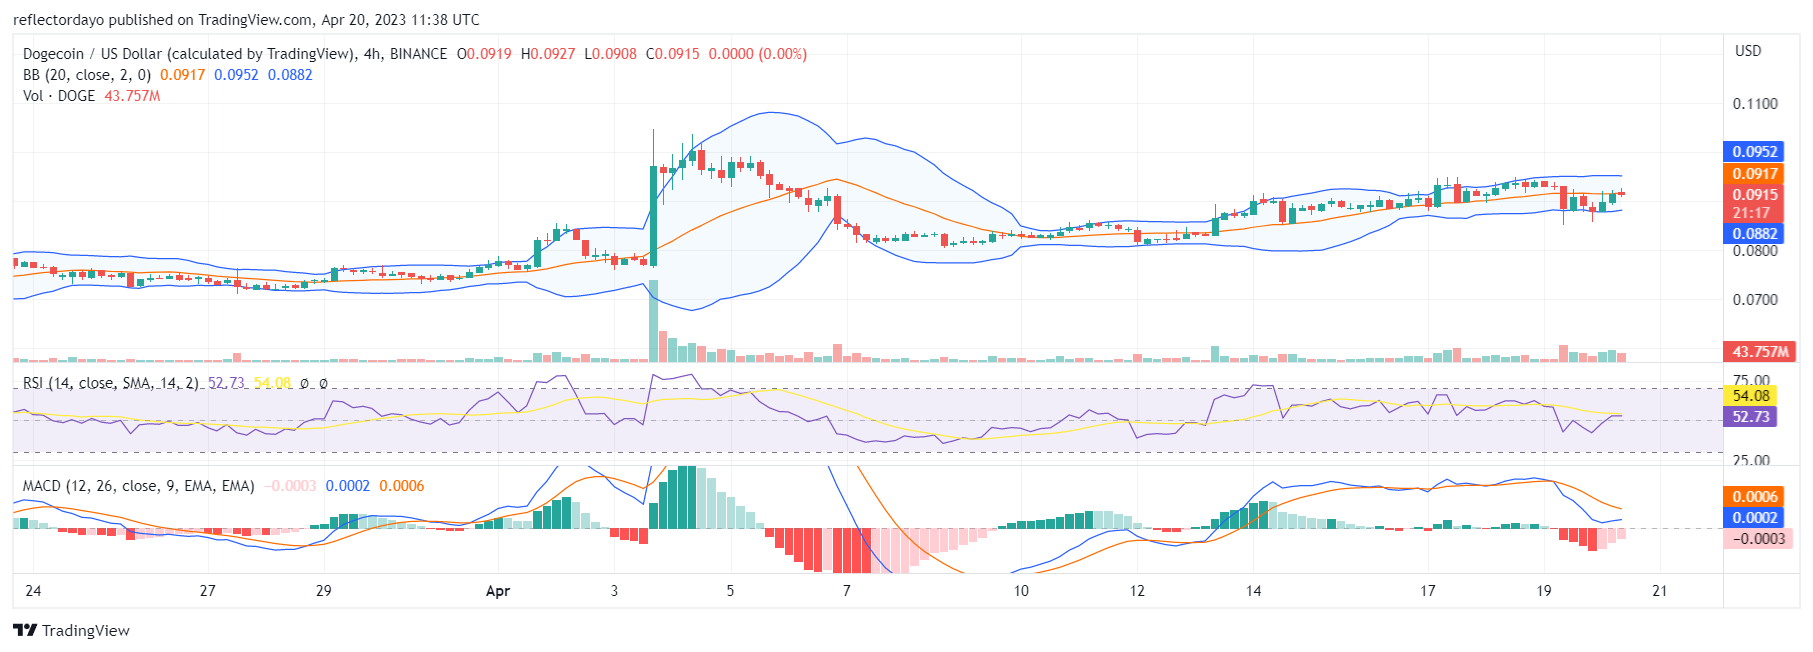
DOGE/USD 4-Hour Chart Outlook:
The recent price pullback in the Dogecoin market may be an opportunity for more bulls to enter the market for profitable deals, as recent moves by key stakeholders of Dogecoin might be the factor propelling the market. It is possible the price will continue to rise. Looking at the 4-hour chart, the Bollinger Bands indicator illustrates the price channel as up-trending, and with the new strong support level that has just formed at $0.0879, the bulls have the chance to pull this up.