XRP Swings in a Range as It Faces Stiff Rejection at $0.57
Estimated Reading Time: 2 minutes
Don’t invest unless you’re prepared to lose all the money you invest. This is a high-risk investment and you are unlikely to be protected if something goes wrong. Take 2 minutes to learn more

XRP (XRP) Long-Term Analysis: Bearish
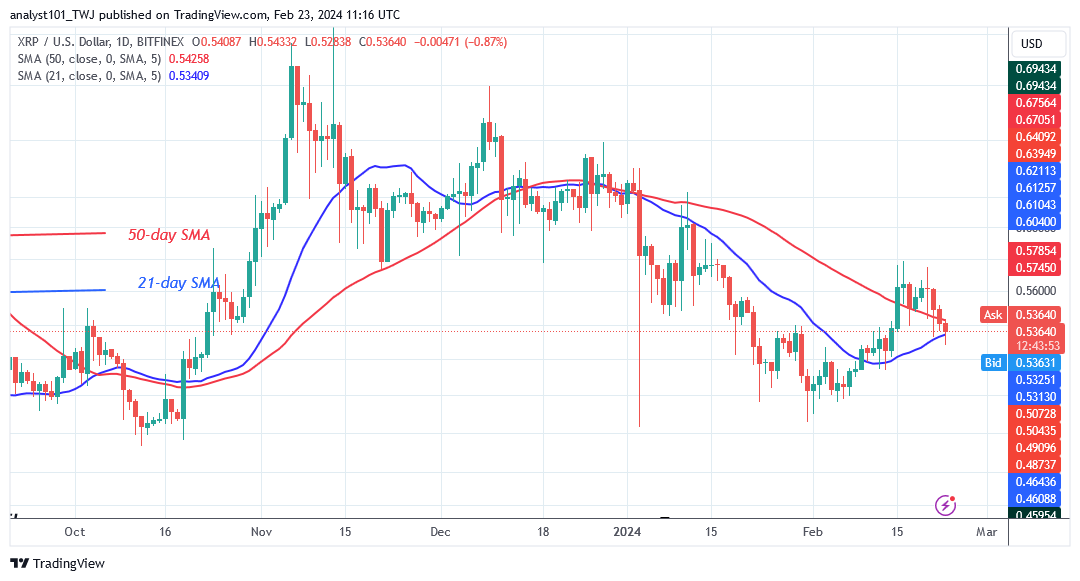
XRP’s (XRP) price has slipped between the moving average lines as it faces stiff rejection at $0.57. The bulls have previously moved above the moving average lines. However, the bullish momentum was broken at a high of $0.57. Today, XRP has fallen to a low of $0.53 and is trading between the moving average lines. If the price falls below the 21-day SMA, the cryptocurrency will continue to decrease.
This will prompt it to revisit its support levels of $0.46 and $0.48. On the other hand, if the altcoin rebounds and breaks above the 50-day SMA, XRP will rise and revisit the previous high of $0.57. If buyers can break through the resistance at $0.57, XRP will resume its bullish trajectory. The crypto will rise higher, reaching a high of $0.67.
Technical Indicators:
Major Resistance Levels – $1.00, $1.50, $2.00
Major Support Levels – $0.50, $0.30, $0.10
XRP (XRP) Indicator Analysis
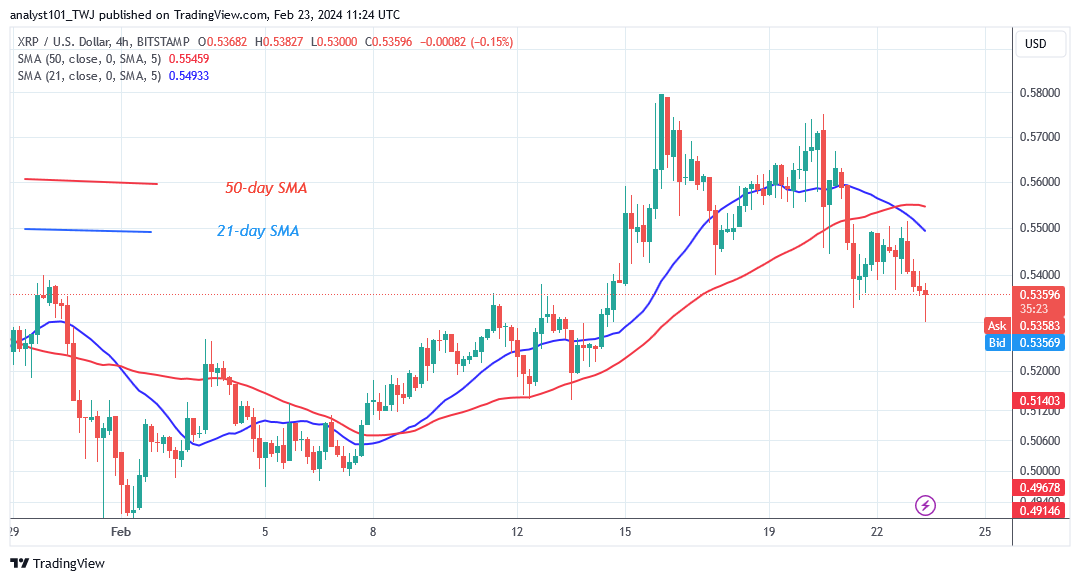
Currently, the price bars are trapped between the moving average lines. This indicates that the market will continue to swing between the moving average lines. On the 4-hour chart, price bars are below the moving average lines but moving upward.
What Is the Next Direction for XRP (XRP)?
The crypto asset lies between the moving average lines as it faces stiff rejection at $0.57. The recent rejection casts doubt on the price’s upward movement. The crypto signal will be bearish if the price falls below the 21-day SMA. The altcoin will resume its selling pressure. Nonetheless, XRP has been trending downward since the January 3, 2024 price collapse. If selling pressure returns, the market will return to its previous bottom.
You can purchase crypto coins here. Buy LBLOCK
Note: Cryptosignals.org is not a financial advisor. Do your research before investing your funds in any financial asset or presented product or event. We are not responsible for your investing results