Chainlink (LINKUSD) Continues to Reach Higher Price levels
Estimated Reading Time: 3 minutes
Don’t invest unless you’re prepared to lose all the money you invest. This is a high-risk investment and you are unlikely to be protected if something goes wrong. Take 2 minutes to learn more
The price of Chainlink has experienced a modest 1.48% movement, but interestingly, its price action has discovered a more robust support level. As a result, this development has significantly accelerated the pace of price upside retracement. The market’s series of progressive higher support levels is a pointer that the market is poised more for bullish action.
Chainlink Network Market Data
- LINK/USD Price Now: $7.938
- LINK/USD Market Cap: $4,278,534,522
- LINK/USD Circulating Supply: 538,099,970
- LINK/USD Total Supply: 1,000,000,000
- LINK/USD CoinMarketCap Ranking: #22
Key Levels
- Resistance: $8.00, $8.50, and $9.00.
- Support: $6.70, $6.00, and $5.50.
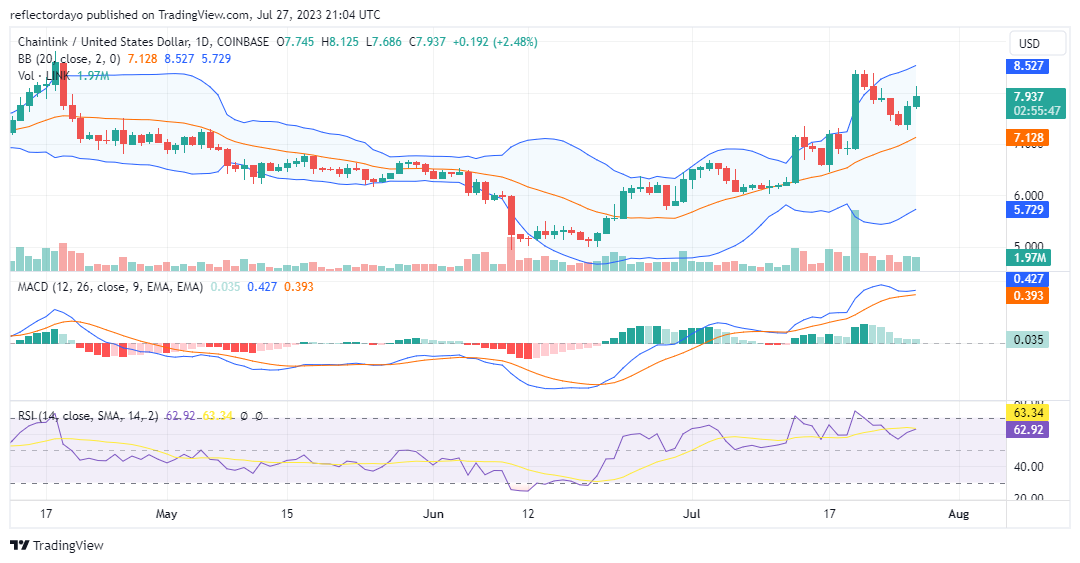
Price Prediction for Chainlink: The Indicators’ Point of View
Looking at the daily chart of Chainlink, approximately seven trading sessions ago, the price broke through the expected price ceiling at $8.00. However, this breakthrough was followed by a sharp downward correction in prices. Fortunately, buyers managed to prevent the price from falling significantly below the $7.50 mark, indicating the potential presence of strong support.
As a result, the price action has continued its upward retracement for a second trading session. The Bollinger Bands suggest that the market is currently experiencing high volatility. Moreover, the Stochastic Relative Strength Index (RSI) indicator is approaching a bullish crossover, which could potentially provide further upside momentum if it materializes. It’s important to keep an eye on these indicators to gauge the market’s future movements.
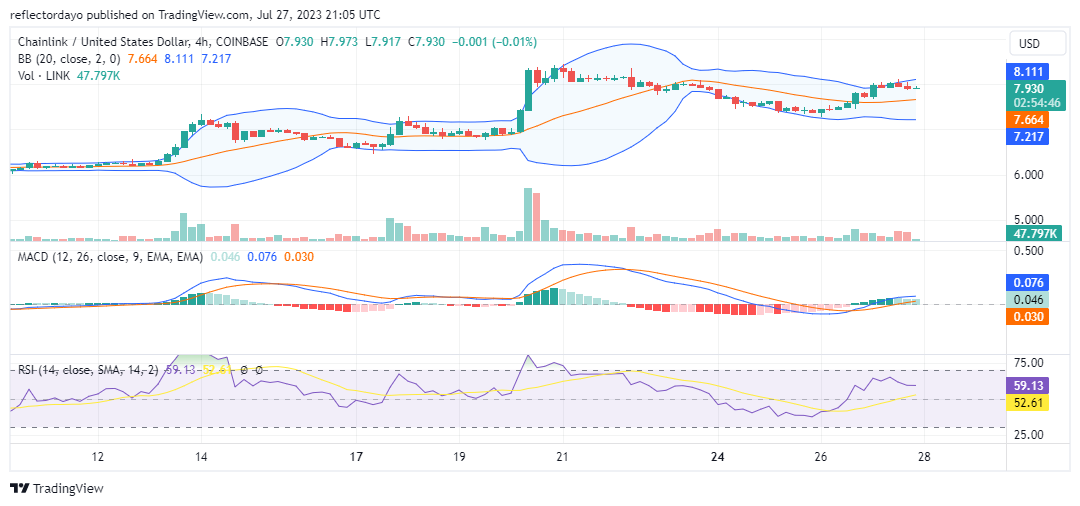
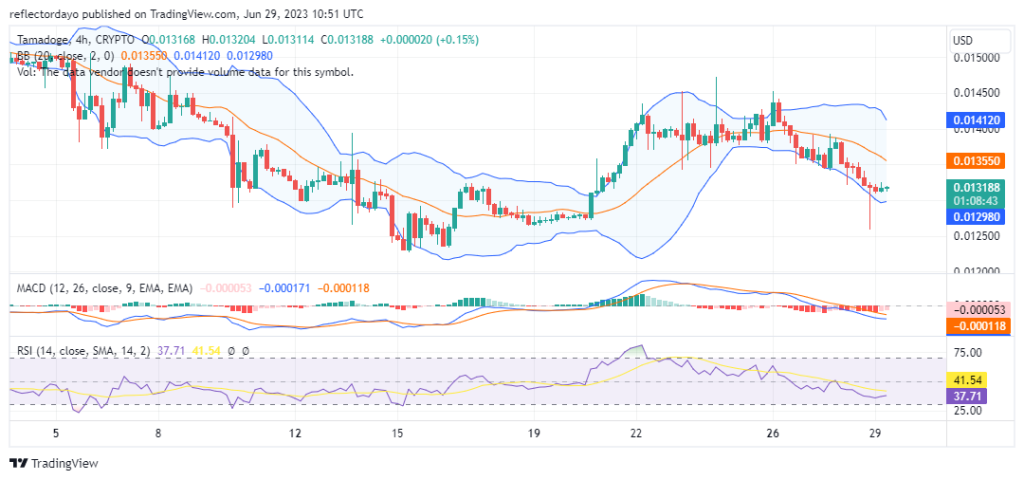
LINK/USD 4-Hour Chart Outlook
On the 4-hour chart for Chainlink, we can observe a recent minimal correction from the $8.00 price level. Despite this correction, the price action remains notably above the Bollinger Bands’ middle limit, indicating a strong position. The market shows moderate volatility at this point.
Additionally, the Moving Average Convergence Divergence (MACD) indicator lines have crossed above the equilibrium level. However, the bars on this indicator are now pale green, suggesting a possible decrease in buyer interest. The Stochastic RSI indicator lines are trending somewhat sideways, indicating a potential temporary stabilization in price.
Considering these factors, the perceived correction may be short-lived, but traders should be cautious about predicting a definitive retracement towards the $9.00 mark. It’s important to monitor further developments closely before making any trading decisions.