Managing Portfolios with Dollar Cost Averaging (DCA)
Estimated Reading Time: 6 minutes
Don’t invest unless you’re prepared to lose all the money you invest. This is a high-risk investment and you are unlikely to be protected if something goes wrong. Take 2 minutes to learn more

Dollar-cost averaging (DCA) stands as a crucial tactic embraced by investors navigating the unpredictable landscapes of digital assets. This method entails consistently investing a predetermined sum, irrespective of the prevailing market cycle. It represents a straightforward yet potent approach, providing a stark contrast to the anxiety-inducing nature of investing in volatile assets, especially for those new to the investment arena. Consequently, DCA is frequently heralded as a practical means of mitigating investment risks.
Analyzing Performance in Bull and Bear Markets
To gauge the worth of any investment, a meticulous examination of its risk-adjusted returns is essential, involving a comparison of diverse assets and strategies. To delve into this, we’ve devised a unique methodology to assess the efficacy of Dollar Cost Averaging (DCA) across a spectrum of over 200 assets. Through simulating a daily $10 investment, commencing on January 1st of 2019, 2021, and 2023, we unravel the impact of distinct market phases on the outcomes. Additionally, we scrutinize how DCA might act as a stabilizing force, providing relief to those seeking to mitigate the turbulence of market fluctuations. It’s crucial to note that transaction fees are not factored into this simplified model.

Examining the chart provided, it’s evident that Dollar Cost Averaging (DCA) has demonstrated a respectable performance, albeit falling slightly short of initial expectations. Notably, a majority of the tested assets, approximately 60%, fall below the breakeven threshold value of the invested cash, with a standing figure of $17,920 for the specified period. The data emphasizes the practicality of DCA, often advocated for investors seeking a disciplined approach amidst the fervor of a bull market, where even seasoned individuals may face losses in the unpredictable landscape of the crypto market.
Performance Trends Post-2023
The year 2023 has ushered in a revitalizing era for digital assets, signaling the prospect of an emerging bull market, notably heightened by the impending Bitcoin halving event in 2024. This upward momentum has propelled prices across the spectrum, as vividly depicted in the chart below.
It underscores the diversity of outcomes, where certain assets undergo substantial appreciation while others undergo more moderate growth, with a considerable portion not reaching the breakeven point of their initial investment, particularly when excluding the top-performing assets.
Standout Performers Among Assets
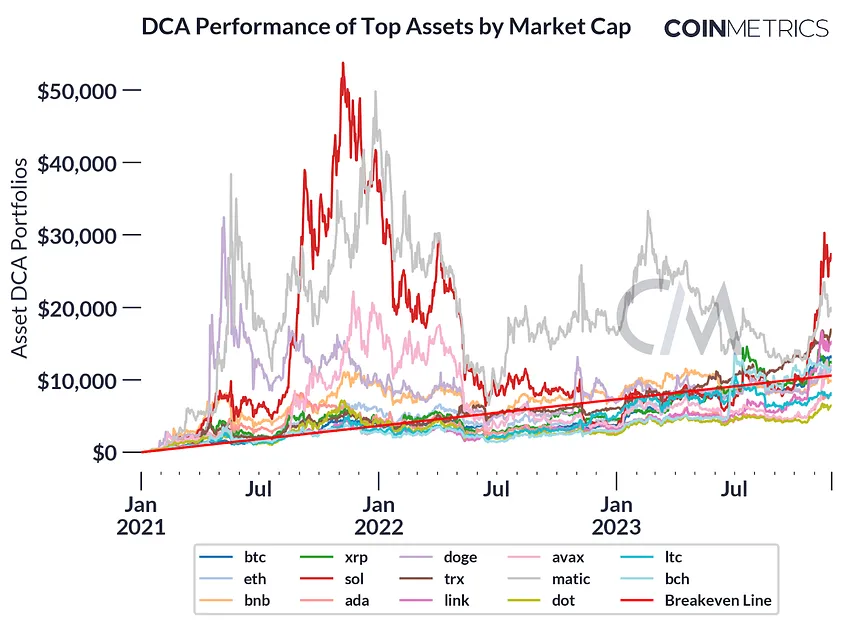
After delving into return distributions across previous periods, our focus shifts to the post-2021 landscape, specifically honing in on the performance of Dollar Cost Averaging (DCA) assets.
Our exploration begins with an examination of the top 15 assets, meticulously sorted by market capitalization. The presented chart unveils a noteworthy observation: even within the realm of highly capitalized assets, DCA portfolios may trail their equivalent cash value. Noteworthy top earners, SOL leading the charge, followed closely by MATIC, have demonstrated impressive returns of 252% and 184%, respectively, within the modeled DCA portfolios.
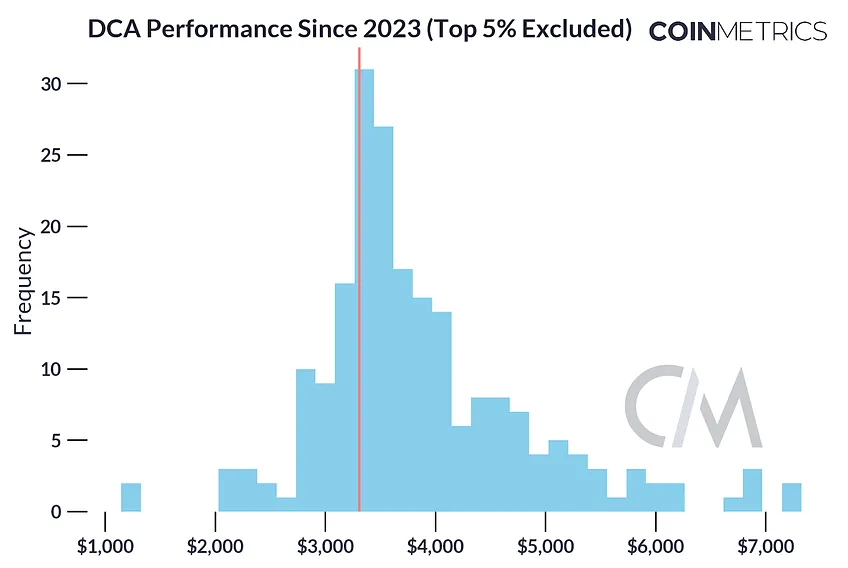
To gain a more nuanced perspective, we categorize returns into percentiles, unraveling the leading assets and their relative performance. The accompanying graph elucidates the DCA performance of assets residing within the top 5% percentile, presented on a logarithmic axis for a clearer view of outlier performances. It’s worth highlighting that a substantial portion of these frontrunners comprise recent market entrants, with APT notably standing out by trading at an impressive 194 times the cash equivalent of the investment, approximately $10.6K.
Emerging Challenges in the Bottom Percentile
The chart below sheds light on a multitude of emerging issues within the bottom 10th percentile, serving as a cautionary signal for any investor contemplating the risk associated with newly issued tokens. Notably, the volatility of these assets reaches such heights that even employing the Dollar Cost Averaging (DCA) method proves insufficient in shielding against the pronounced and abrupt market swings. While a handful of assets showcase an impressive surge and apparent resilience, a more extensive number experience fleeting elevation only to descend just as swiftly as they initially surfaced.
BTC Insight
Crypto downturns can be formidable, and the stretch from fall 2021 to fall 2022 posed challenges for digital asset holders. Yet, bitcoin emerges as a beacon for the effectiveness of a Dollar Cost Averaging (DCA) strategy, revealing a somewhat surprising revelation.
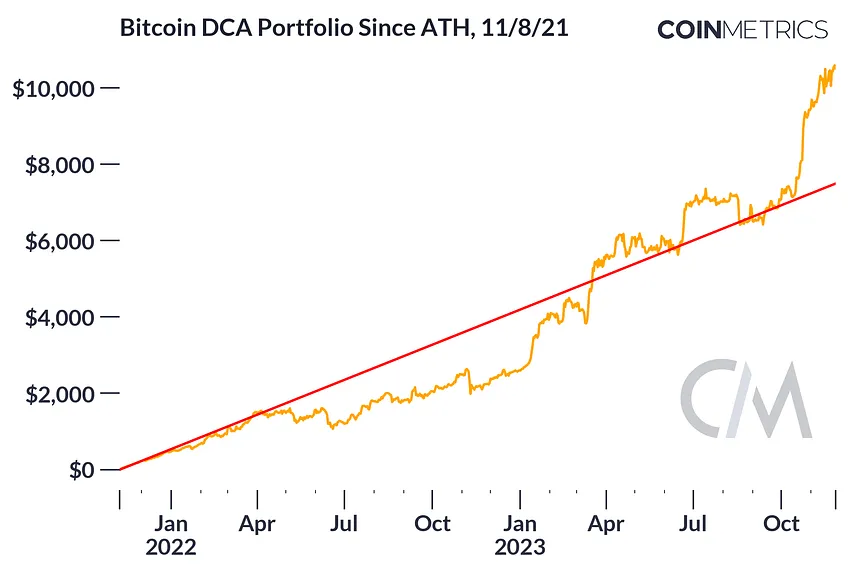
Initiating the daily $10 DCA strategy at BTC’s all-time high price of $67.5K on November 8, 2021, results in a current portfolio gain of approximately 33%. In this hypothetical scenario, with precisely $7,500 invested, the portfolio would now exceed $10,000 (disregarding trading fees on exchanges). Despite enduring a predominantly negative trajectory in 2022, the portfolio managed to turn positive in the spring of the following year.
Closing Thoughts
The scrutiny of dollar cost averaging (DCA) in the digital asset realm underscores its role in mitigating volatility but dispels the notion of a guaranteed positive return. The diverse outcomes, notably the underperformance of several assets despite a disciplined investment strategy, underscore the inherent limitations of the approach. DCA, while effective in curbing certain risks, proves not to be a universal panacea, susceptible to the intricacies of the market. In practical applications, investors must factor in trading fees and carefully evaluate the optimal exchange(s) for executing their orders.