SPONGE/USD ($SPONGE) Bulls Regroup at $0.0001015, as Target Still Remains at Higher Levels
Estimated Reading Time: 3 minutes
Don’t invest unless you’re prepared to lose all the money you invest. This is a high-risk investment and you are unlikely to be protected if something goes wrong. Take 2 minutes to learn more
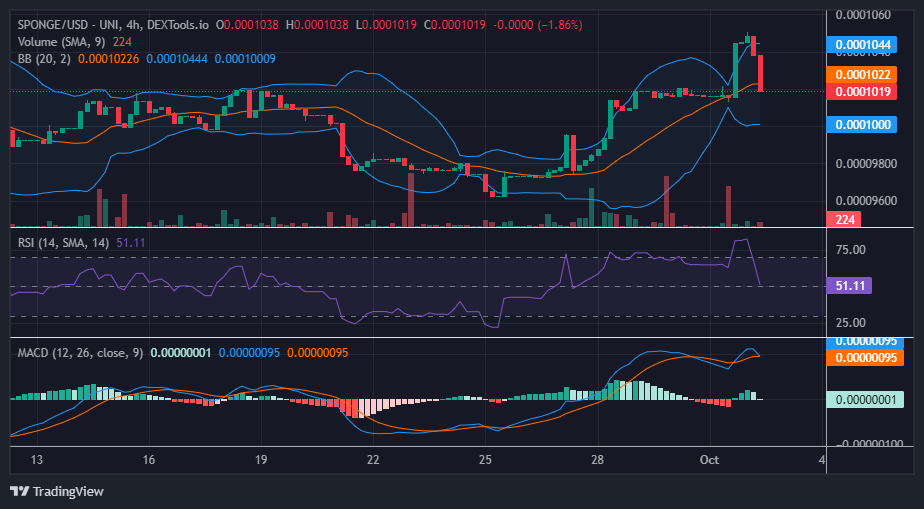
In our recent analysis of the SPONGE/USD market, we observed notable factors that suggested a potential upward movement. Specifically, the candlestick’s resistance to bearish pressure and sudden volatility squeeze hinted at the possibility of a bullish breakout. Bulls were actively working to assert dominance in what had previously been bearish territory, leading to a significant price surge to $0.0001045, which ultimately triggered a bearish correction.
As the market retraces to lower levels, the $0.0001015 price point, where the market previously consolidated, is likely to serve as a robust support level, as it marked the starting point of the recent bullish trend. This newfound price level has been successfully established with the support of the bullish participants.
Key Levels
- Resistance: $0.000115, $0.000120, and $0.000125.
- Support: $0.000090, $0.000080, and $0.000085.
Sponge (SPONGE/USD) Price Analysis: The Indicators’ Point of View
On October 1, the entire trading session was characterized by bullish dominance, propelling the price to a high of $0.0001045. However, in today’s SPONGE/USD market, bears have exerted downward pressure, and it is probable that the $0.0001015 price level will serve as a key support, potentially initiating an upward bounce. The presence of this support offers an opportunity for the bulls to continue driving the market on an upward trajectory.
Presently, all indicators point towards a substantial price retracement, driven by heightened levels of volatility. The Relative Strength Index (RSI) demonstrates the market’s retracement from the overbought region towards the indicator’s midpoint. Given the current market conditions, either a further eastward price movement or a bounce is anticipated as a result of this development.
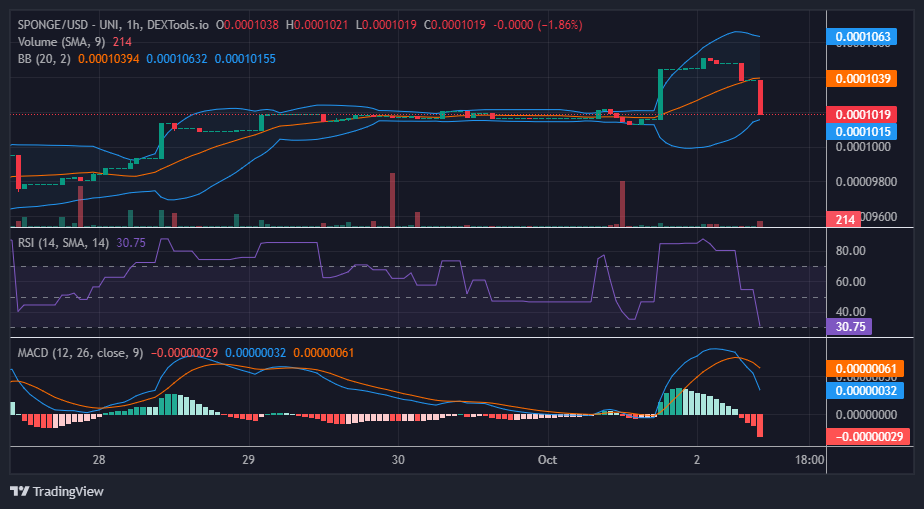
$SPONGE Short-Term Outlook: 1-Hour Chart
On a shorter-term time frame analysis, the market has retraced to the border of the oversold territory. This suggests that the bearish momentum is likely to weaken around this level. There is an increasing likelihood that the current signal provided by the 1-hour chart indicators may stimulate buying interest. The ensuing price rally could potentially enable the bulls to assert control over additional areas previously dominated by bears.
Take advantage of the MemeCoin’s enticing currents and start surfing the SPONGE wave right away!
🧽🌊 Ready to plunge into $SPONGE trading on @MEXC_Official? 🎊💰
🧽🏄♂️ Catch the currents of this intriguing #MemeCoin and ride the #SPONGE wave starting now! 🚀🌊
🔗https://t.co/idowker7B5 pic.twitter.com/scWvhGFsXa
— $SPONGE (@spongeoneth) October 2, 2023
Invest in the hottest and best meme coin. Buy Sponge ($SPONGE) today!