Arbitrum Price Prediction: ARB/USD Could Spike Above $1.80 Level
Estimated Reading Time: 3 minutes
Don’t invest unless you’re prepared to lose all the money you invest. This is a high-risk investment and you are unlikely to be protected if something goes wrong. Take 2 minutes to learn more
Arbitrum Price Prediction – April 18
Arbitrum price prediction reveals that if bulls keep the market price above the 9-day and 21-day moving averages; it will head to the upside.
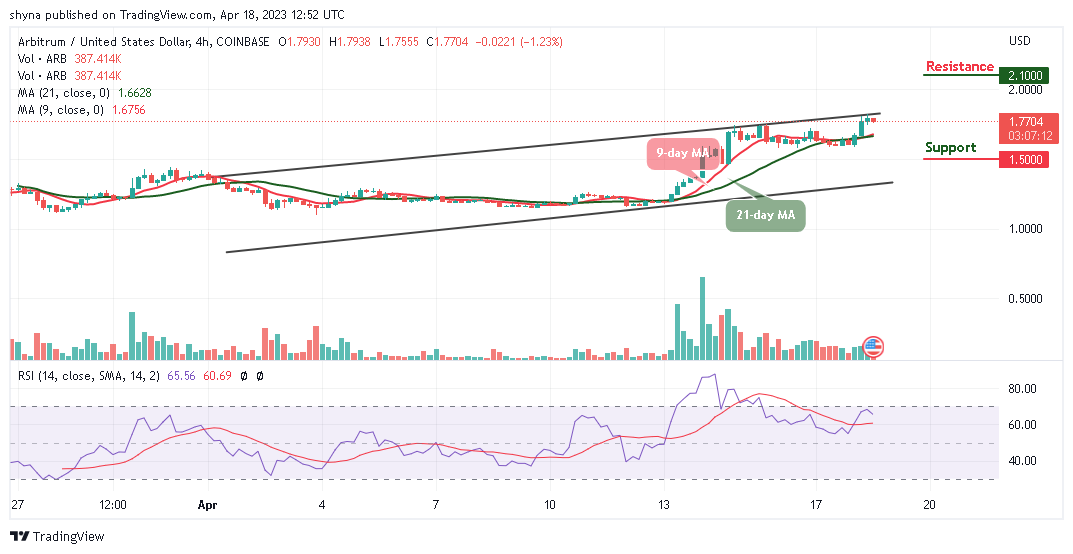
ARB/USD Medium-term Trend: Bullish (4H Chart)
Key Levels:
Resistance levels: $2.10, $2.30, $2.50
Support levels: $1.50, $1.30, $1.10
ARB/USD is hovering above the 9-day and 21-day moving averages as the market price gradually trends upward. Meanwhile, the coin hovers at $1.77, it could move further if the bulls increase the buying pressure and push the coin toward the resistance level of $1.80 resistance level. On the contrary, if the bulls fail to cross above the upper boundary of the channel, the Arbitrum price could slide below the moving averages and head toward the lower boundary of the channel.
Arbitrum Price Prediction: ARB/USD Would Head to the Upside
The daily confirms that Arbitrum price will follow the bullish movement where it could reclaim the resistance level of $1.81. Once this comes to focus, the potential resistance levels at $2.10, $2.30, and $2.50 could be located. But if not, heading toward the lower boundary of the channel could hit the support levels at $1.50, $1.30, and $1.10 so that new buyers can come into the market as the technical indicator Relative Strength Index (14) remains above the 60-level.
ARB/USD Medium-term Trend: Ranging (1H Chart)
Arbitrum price is sliding below the 9-day moving average as the coin heads toward the lower boundary of the channel if the sellers increase the pressure. However, the technical indicator Relative Strength Index (14) confirms the bearish movement as the signal line moves to cross below the 60-level. Meanwhile, staying above the moving averages could prepare the buyers for the upward movement.
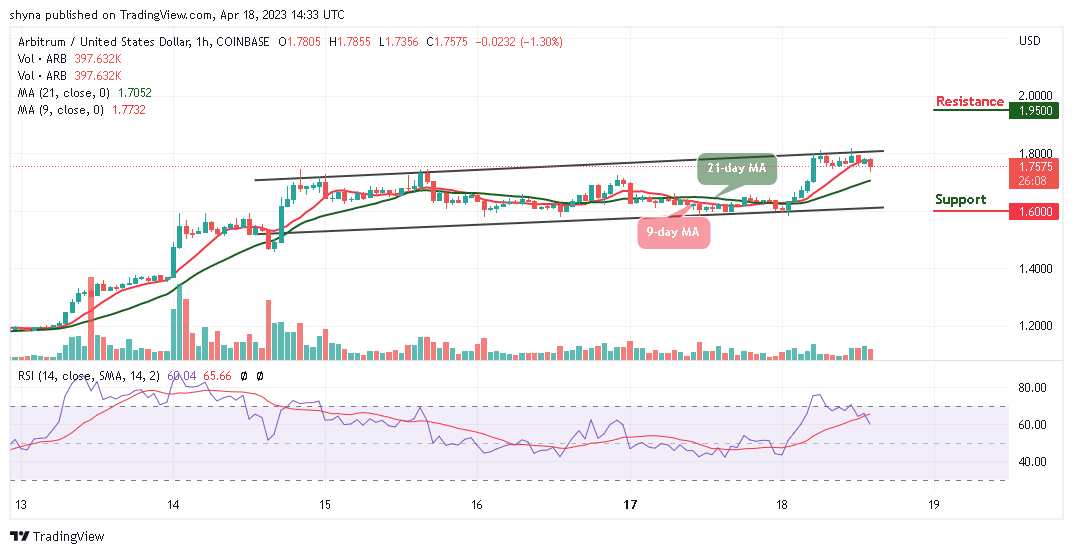
However, any bullish movement above the upper boundary of the channel could hit the resistance level at $1.95 and above. Nevertheless, ARB/USD could display some bearish signals if the market price slides below the 21-day moving average, and it could locate critical support at $1.60 and below. Therefore, this is the best opportunity for the existing buyers to buy the dips while the new buyers are expected to come into the market.
Place winning Arbitrum trades with us. Get ARB here