Binance Coin (BNB) Declines as It Continues to Face Rejection at $320
Estimated Reading Time: 2 minutes
Don’t invest unless you’re prepared to lose all the money you invest. This is a high-risk investment and you are unlikely to be protected if something goes wrong. Take 2 minutes to learn more

Binance Coin (BNB) Long-Term Analysis: Bearish
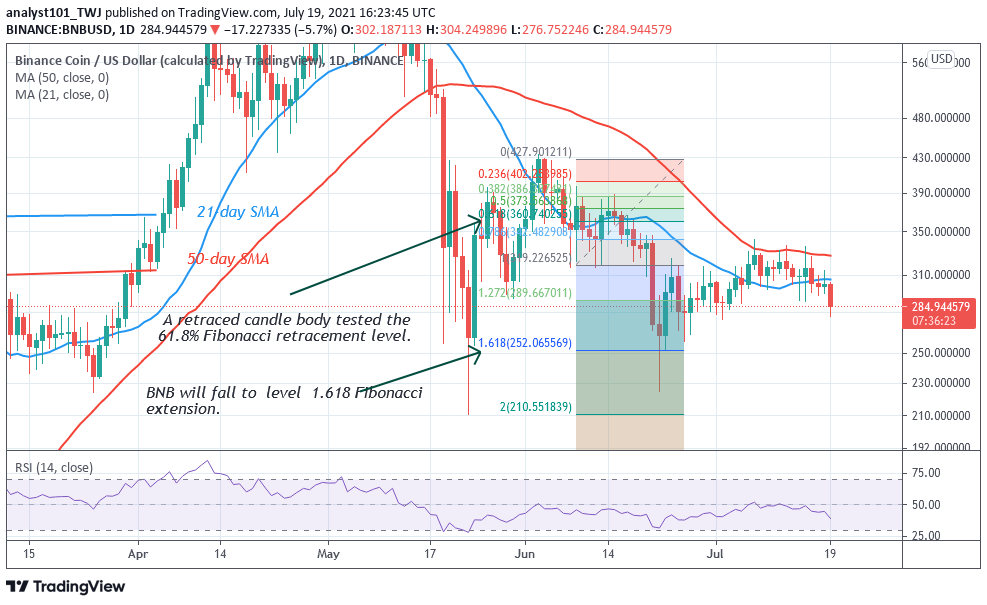
Binance Coin’s upward correction was rejected thrice at the $330 high as altcoin resumes a downward move. The selling pressure is likely to continue as price breaks below the moving averages. The current downtrend is likely to reach the previous low at $210. Meanwhile, on June 9 downtrend; a retraced candle body tested the 61.8% Fibonacci retracement level. The retracement indicates that the coin will fall to level 1.618 Fibonacci extension or a level of $252.06.
Binance Coin (BNB) Indicator Analysis
The crypto has fallen to level 38 of the Relative Strength Index period 14. The coin is in the downtrend zone and below the centerline 50. The altcoin is falling and approaching the oversold region of the market. Nonetheless, BNB is below the 20% range of the daily stochastic. It indicates that the crypto is now in the oversold region of the market.

Technical indicators:
Major ResistancIs ie Levels – $640, $660, $680
Major Support Levels – $540, $520, $500
What Is the Next Direction for Binance Coin (BNB)?
The crypto is in a downward move. On the 4 hour chart, BNB price is making a series of lower highs and lower lows. Meanwhile, on July 9 downtrend; a retraced candle body tested the 38.2% Fibonacci retracement level. The retracement indicates that the coin will fall to level 1.618 Fibonacci extension or a level of $242.54.

You can purchase crypto coins here. Buy Tokens
Note: Cryptosignals.org is not a financial advisor. Do your research before investing your funds in any financial asset or presented product or event. We are not responsible for your investing results