Polygon (ex-MATIC) Price Prediction: POL/USDT Rebounds Off the $0.3600 Baseline
Estimated Reading Time: 3 minutes
Don’t invest unless you’re prepared to lose all the money you invest. This is a high-risk investment and you are unlikely to be protected if something goes wrong. Take 2 minutes to learn more
Polygon (ex-MATIC) Price Prediction for November 16
Price activity in the Polygon market appears to have initiated a pattern of forming higher lows. This trend seems to have commenced since the market rebounded off the support at the $0.2900 price level. The market subsequently found another higher support level in the previous session, and the ongoing session has continued to pursue higher price levels.
POL/USDT Long-Term Trend: Bullish (Daily Chart)
Key Price Levels:
Resistance: $0.4000, $0.4200, $0.4600
Support: $0.3600, $0.3400, $0.3200
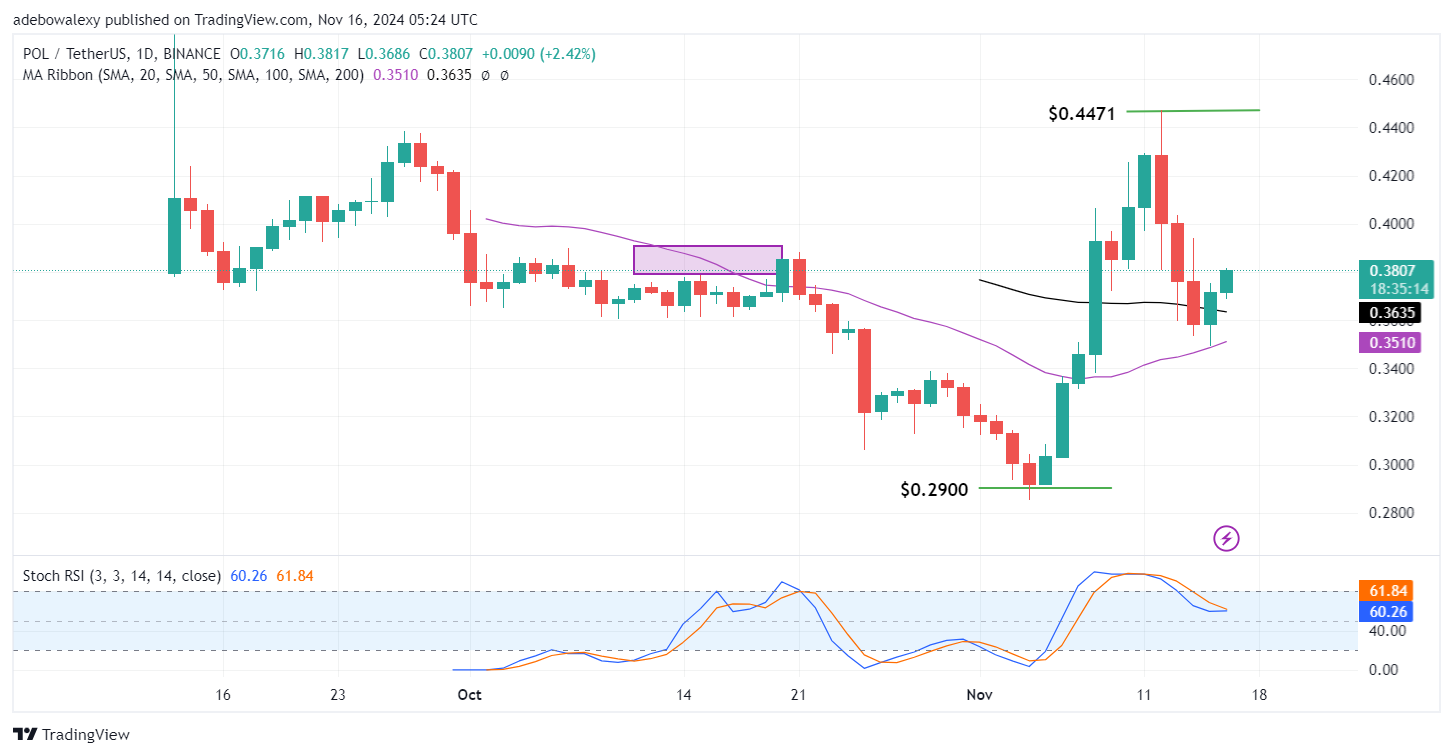
The last two price candles on this chart are bullish. They also indicate that buying activity has resumed within the market. The latest price candle can be observed above the two Moving Average (MA) lines on the chart. Simultaneously, the Stochastic Relative Strength Index (Stochastic RSI) lines are converging towards a bullish crossover at the 60 level of the indicator.
Polygon (ex-MATIC) Price Prediction: POL/USDT Eyes the Next Psychological Resistance
The Polygon (ex-MATIC) market is gradually recovering towards previously attained higher levels. The market had experienced a strong downward correction after encountering resistance at the $0.4471 price level. However, the support level at the $0.3600 price level proved to be effective, with price action rebounding off it. The current session has continued its upward movement, trading above all the MA lines.
Furthermore, the Stochastic RSI lines have indicated that the upward retracement will likely continue. This can be observed as the lines of the indicator are now converging towards a bullish crossover. Therefore, traders can anticipate that the market will continue to move higher in subsequent sessions, based on the available indicators.
Polygon (ex-MATIC) Price Prediction: POL/USDT Bulls Are Maintaining Optimism (4-Hour Chart)
Bullish indications are also evident in the Polygon (ex-MATIC) 4-hour market. Here, price action is positioned above three out of four of the MA lines on the chart. The latest price candle, while smaller, remains green, indicating that upward forces are still prevailing. Meanwhile, the Stochastic RSI lines are still ascending into the overbought region.
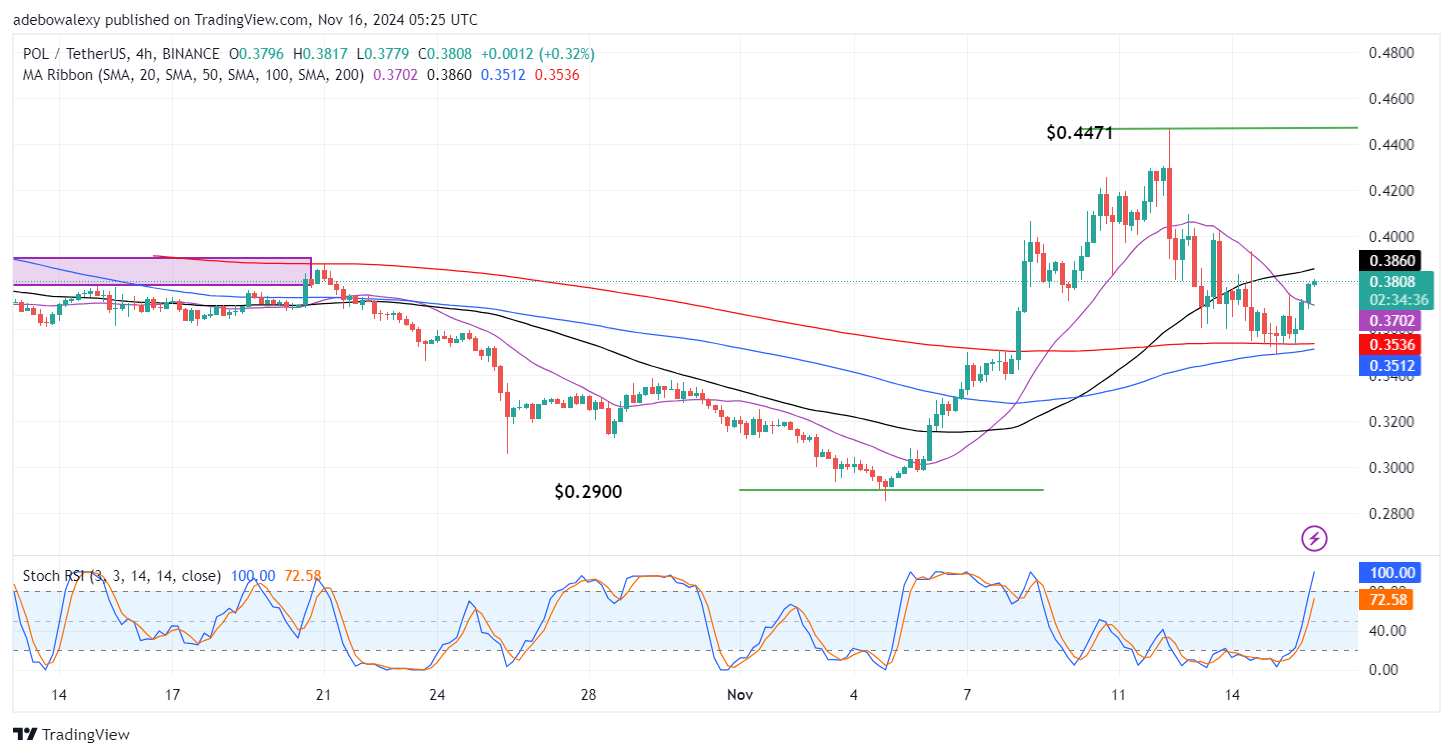
Technically, this market appears poised for a continued upward retracement. This assessment stems from the observation that price activity remains above most of the MA lines. Additionally, the Stochastic RSI lines can be seen still rising into the overbought region. However, the leading line of this indicator appears overextended, as it is already at the 100 level of the indicator following such a moderate price increase. Therefore, this suggests that a target at the $0.4000 mark may be a realistic expectation in this market.