Uniswap (UNI) Price Prediction: UNI/USDT Stays Below the $10.00 Mark
Estimated Reading Time: 3 minutes
Don’t invest unless you’re prepared to lose all the money you invest. This is a high-risk investment and you are unlikely to be protected if something goes wrong. Take 2 minutes to learn more

The Uniswap daily market has remained below the $10.00 price level ever since it witnessed a strong upward price correction eight sessions ago. This suggests that the market has drawn unwanted bearish attention, making it difficult for prices to increase at this point.
UNI/USDT Long-Term Trend: Bearish (Daily Chart)
Key Price Levels:
Resistance: $10.00, $12.00, $14.00
Support: $8.00, $6.00, $4.00
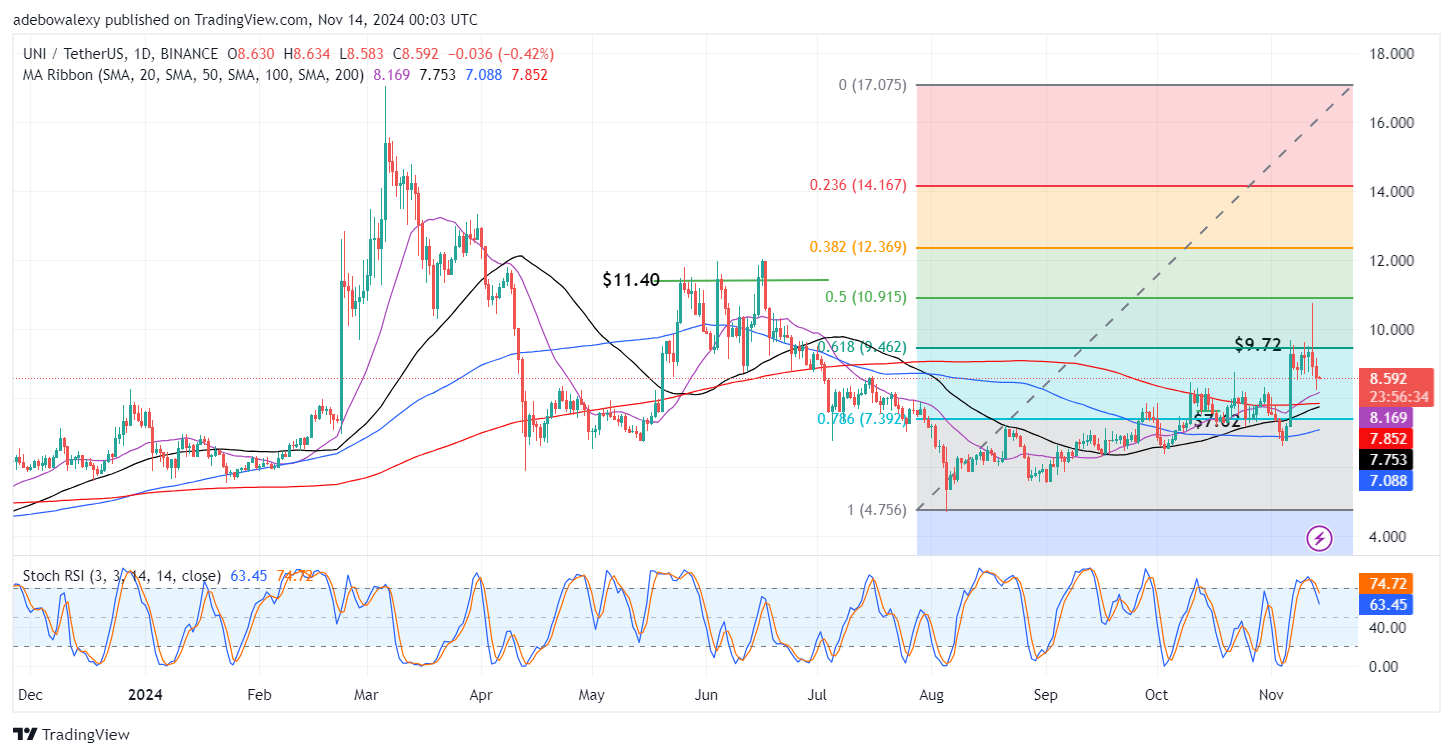
Since the significant price increase in the Uniswap daily market eight sessions ago, the market has been moving sideways. However, when the market tested the $10.00 level during the past two sessions, it took a more bearish path. Yet, this coin trades above all the Moving Average (MA) lines. Also, the Stochastic Relative Strength Index (RSI) lines are now falling toward the 60 mark of the indicator.
Uniswap (UNI) Price Prediction: UNI/USDT Market Looks for a Support Level
Price movement in the Uniswap daily market hasn’t been able to rise considerably for the past seven trading sessions. However, the attempt to surpass the $10.00 mark met a strong downward rejection. This has brought the market toward the $8.50 threshold.
Also, the Stochastic RSI lines can be seen falling toward the 60 mark of the indicator following a downward crossover in the overbought region. Despite this, price action in this market remains above the MA lines. The ongoing session is bearish even at its early stage, hinting that we may see more price declines as the session progresses.
Uniswap (UNI) Price Prediction: UNI/USDT Comes Under Bearish Pressure (4-Hour Chart)
The Uniswap market on the 4-hour chart can be seen to have maintained consistency with price movement in the daily market. The ongoing session stays bearish and has almost the same magnitude as the daily chart. Meanwhile, the 20- and 50-day MA lines converge above the last two price candles on this chart. The Stochastic RSI lines have also delivered another bearish crossover in the oversold region.
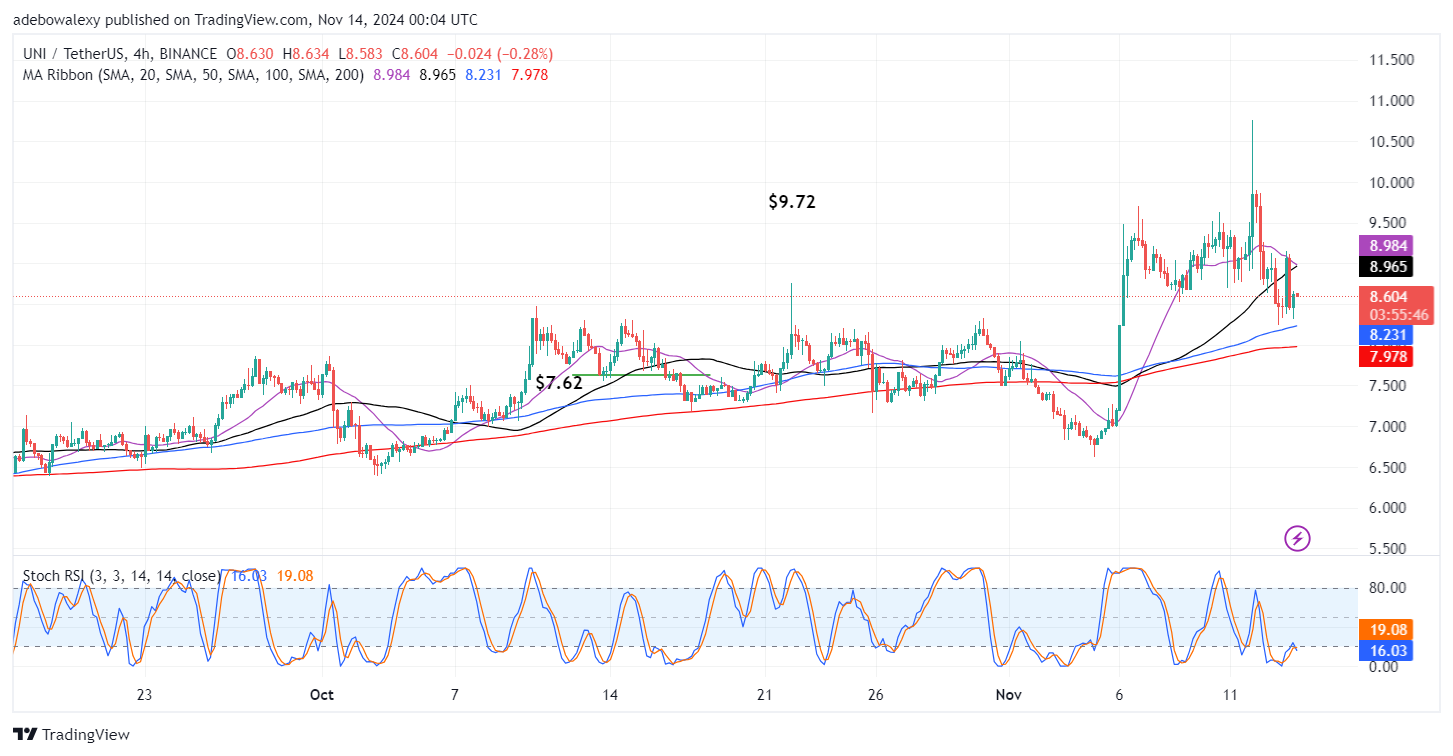
Therefore, indications arising from this market suggest that downward forces are likely to further price declines. This opinion arises from the activities of the 20- and 50-day MA lines above recent price candles. Also, the activity of the Stochastic RSI confirms that price action remains under bearish pressure. Consequently, should price action fail to rebound off the $8.50 level, it may occur off the $8.231 price level.