Bitcoin (BTC) Price Prediction: BTC/USDT Upside Correction Pauses at $90K
Estimated Reading Time: 3 minutes
Don’t invest unless you’re prepared to lose all the money you invest. This is a high-risk investment and you are unlikely to be protected if something goes wrong. Take 2 minutes to learn more

Bitcoin has been on a strong upward trend for the past few days. However, the market has recently bounced off the $90,000 resistance level. Today’s trading session has extended this downward correction.
BTC/USDT Long-Term Trend: Bearish (Daily Chart)
Key Price Levels:
Resistance: $90,000, $95,000, $100,000
Support: $85,000, $80,000, $75,000
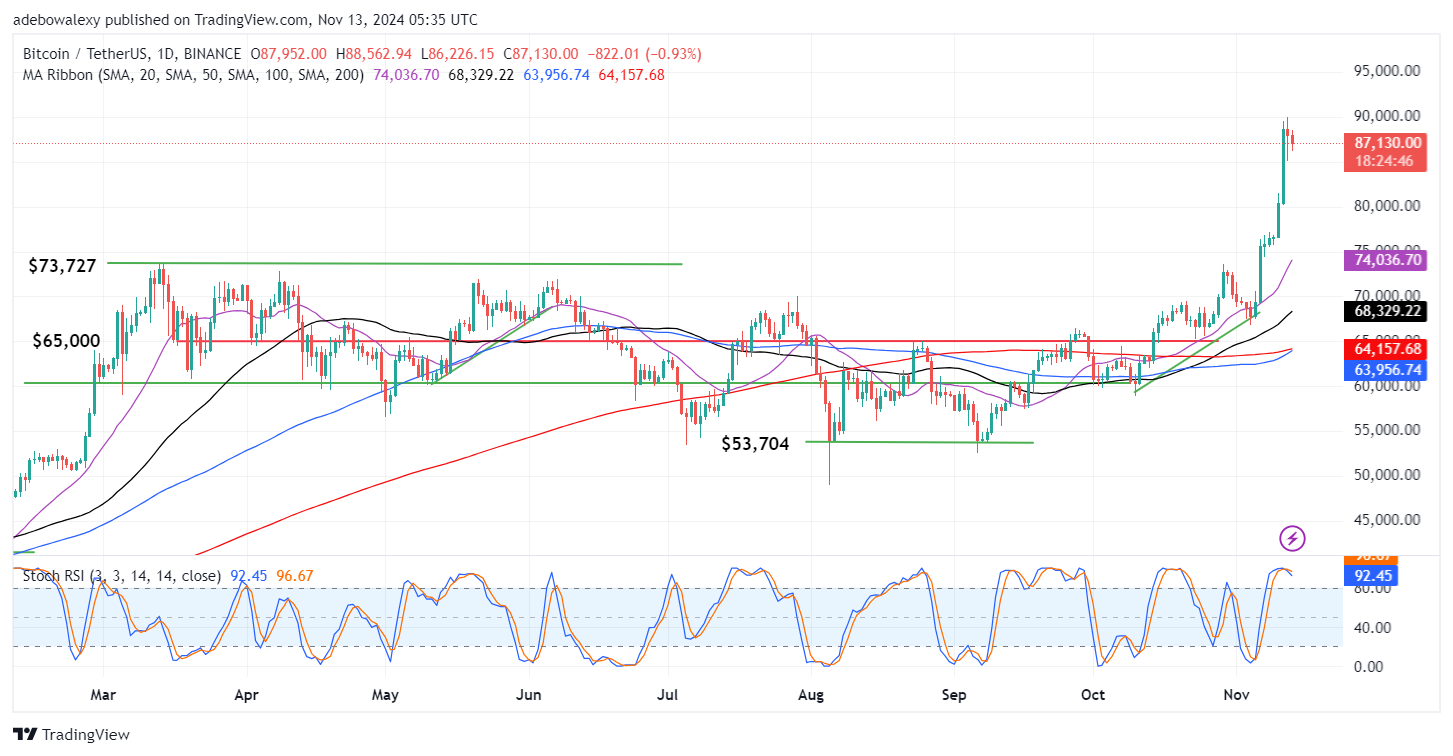
The latest price candle on the BTC/USDT daily chart is bearish. This has brought the market closer to the $87,000 support level. Nevertheless, price action remains significantly above all the Moving Average (MA) lines. Due to the downward correction, the Stochastic Relative Strength Index (RSI) lines are falling towards the 80 level. However, there is still a considerable distance between the indicator lines and the 80 mark.
Bitcoin (BTC) Price Prediction: BTC/USDT Eyes the Support at $85,000 Price Level
Based on the daily chart, the Bitcoin market still appears to be in a strong uptrend. The recent downward correction has had a minimal impact on the overall market. The current session has brought the market lower, but the $90,000 resistance level remains unbroken. Price action remains well above the MA lines, suggesting that bullish momentum is still strong.
The position of the Stochastic RSI lines in the overbought region indicates that the market is still in bullish territory, despite the recent downward correction. This suggests that a further upward move may be imminent.
Bitcoin (BTC) Price Prediction: BTC/USDT Market Prepares to Hit the 86,624 Support Level (4-Hour Chart)
On the Bitcoin 4-hour chart, the current session has been bearish, marking the third consecutive bearish session. The size of the latest price candle suggests that bearish momentum is limited. The current price is just above the $86,624 support level, and trading activity remains above all MA lines. The Stochastic RSI lines are falling rapidly into the oversold region, indicating potential downward pressure.
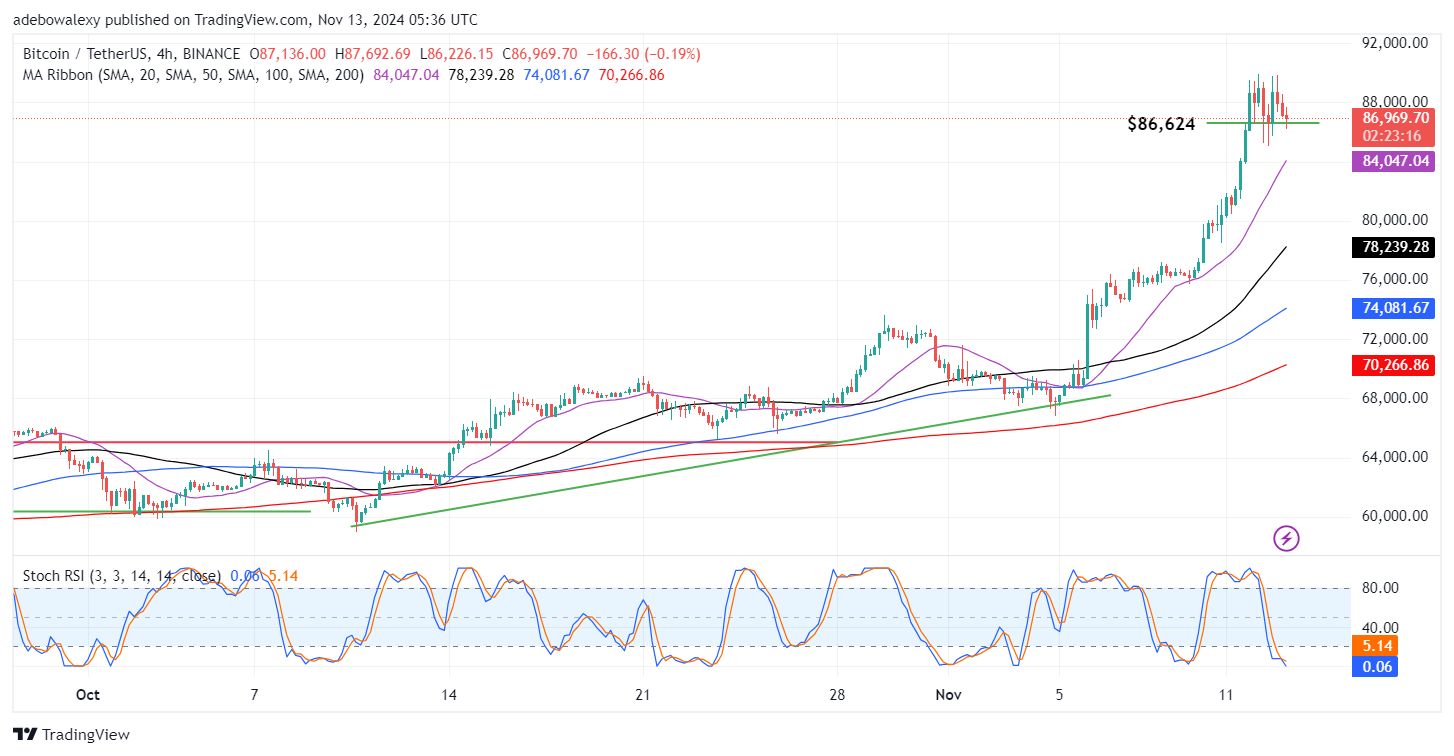
However, the position of the price above the immediate support level of $86,624 and the psychological support level of $85,000, combined with the MA lines, suggests that the market may soon resume its upward trend. The behavior of the Stochastic RSI, which is not fully aligned with the price action, hints that downward pressure may be limited. Therefore, traders may anticipate an upward rebound from the $86,000 or $85,000 levels.