Helium (HNT/USD) Price Stalls at $8: Bulls and Bears Battle for Control
Estimated Reading Time: 3 minutes
Don’t invest unless you’re prepared to lose all the money you invest. This is a high-risk investment and you are unlikely to be protected if something goes wrong. Take 2 minutes to learn more
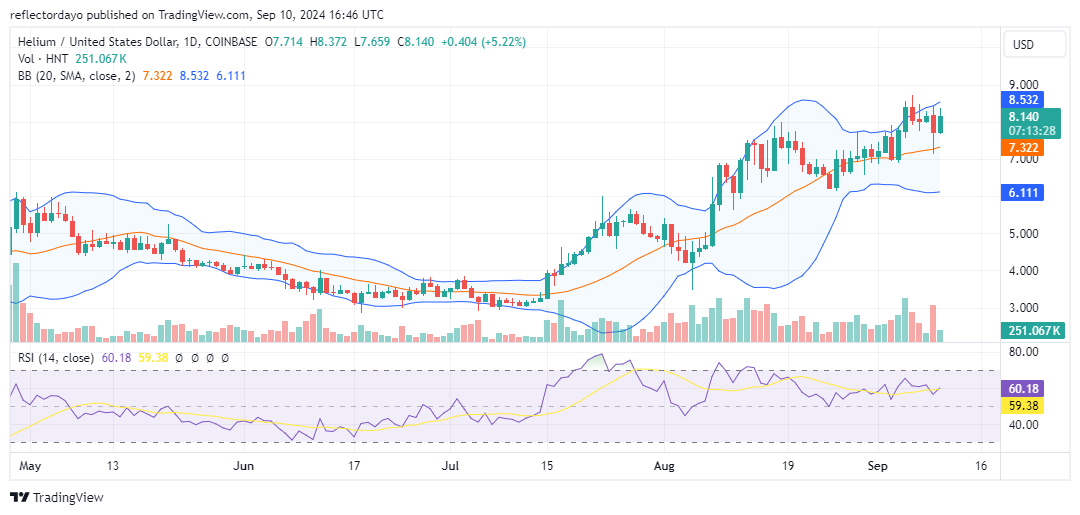
The Helium market exhibited a state of equilibrium in today’s trading session, with the price oscillating around the $8.00 level. This tug-of-war between bullish and bearish forces has resulted in a period of price consolidation.
Despite the bearish pressure, the Helium market has demonstrated resilience. During previous consolidation phases near the $8.00 level, there were concerns about a potential market reversal. However, the recent price test of the $7.30 level suggests that bullish sentiment remains strong.
This market dynamic indicates that bullish forces are still capable of driving the price higher. However, it’s essential to monitor the market closely for any signs of a shift in momentum, particularly if the price breaks below the $8.00 support level.
The Helium Market Data
- HNT/USD Price Now: $8.17
- HNT/USD Market Cap: $ 1.3 billion
- HNT/USD Circulating Supply: 161million
- HNT/USD Total Supply: 161 million
- HNT/USD CoinMarketCap Ranking: #52
Key Levels
- Resistance: $8.50, $9.00, and $9.50
- Support: $7.00, $6.50, and $6.00.
The Helium Market Through the Lens of Indicators
The Helium market’s swift recovery from the $7.30 price level suggests that bullish sentiment remains intact. However, the presence of an upper shadow on today’s candlestick indicates that bearish pressure may be intensifying above the $8.00 level.
The market’s current oscillatory behavior is likely to persist, especially given the wide Bollinger Bands. This crypto signal suggests a state of equilibrium between buyers and sellers, despite the heightened volatility. Traders should anticipate more erratic price movements in the near term.
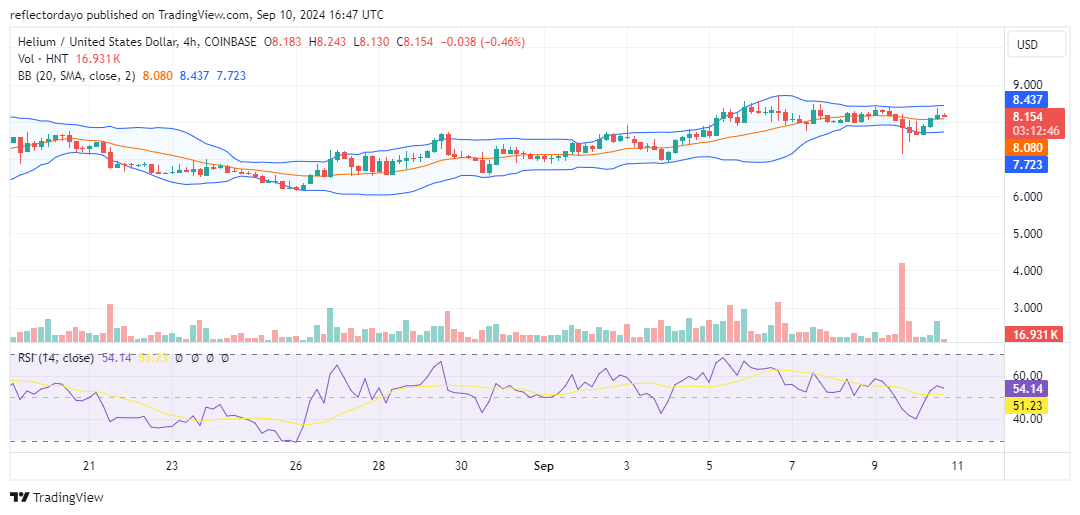
HNT/USD Price Prediction: 4-Hour Chart Analysis
The 4-hour chart reveals a period of price consolidation around the $8.00 level. While the price briefly dipped to $7.30, strong bullish sentiment drove it back above the $8.00 support.
Unlike the diverging Bollinger Bands on the daily chart, which indicate high volatility, the 4-hour chart shows a narrower band and smaller volume histograms. This suggests a period of market indecision.
The emergence of a crypto signal could be a precursor to a significant directional move. Traders should closely monitor the market for signs of a breakout or breakdown.