Fantom (FTM/USD) Eyes $0.50 Milestone
Estimated Reading Time: 3 minutes
Don’t invest unless you’re prepared to lose all the money you invest. This is a high-risk investment and you are unlikely to be protected if something goes wrong. Take 2 minutes to learn more
Fantom‘s market experienced a downward trend in July, but found support and a pivotal level near $0.300 in August. This support facilitated a price surge, propelling the market upward. After encountering resistance at $0.40, Fantom successfully broke through this barrier and briefly tested the $0.50 threshold. However, bullish momentum could not be sustained at this level, resulting in a bearish reversal that drove the price back towards $0.40.
The Fantom Market Data
- FTM/USD Price Now: $0.44
- FTM/USD Market Cap: $ 1.2 billion
- FTM/USD Circulating Supply: 2.8 billion
- FTM/USD Total Supply: 3.2 billion
- FTM/USD CoinMarketCap Ranking: #56
Key Levels
- Resistance: $0.50, $0.55, and $0.60
- Support: $0.35, $0.30, and $0.25.
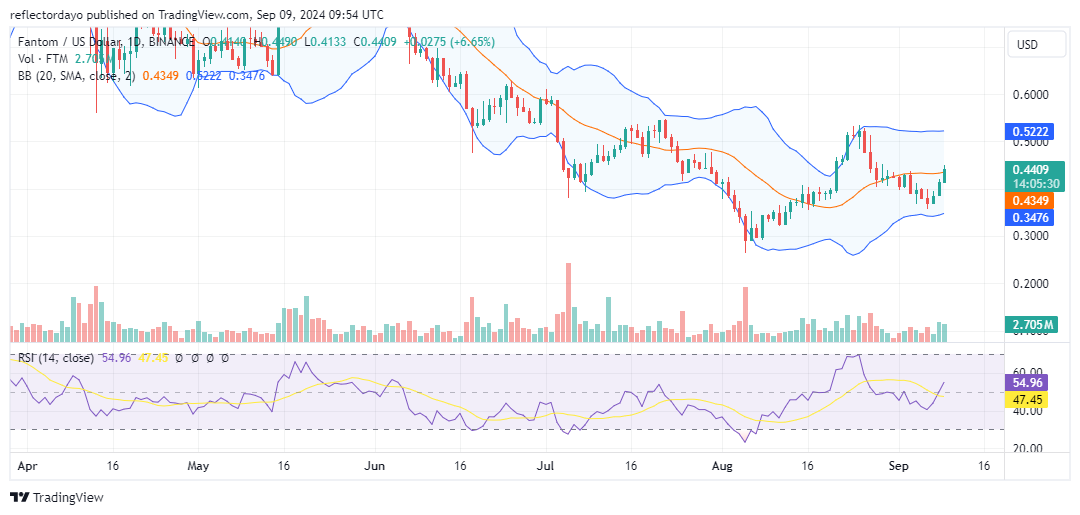
The Fantom Market Through the Lens of Indicators
The market exhibited volatility in the latter half of August and September, with a price channel ranging from $0.35 to $0.52. A significant bearish reversal pushed prices below the $0.40 mark before finding support and rebounding above this level. The market is currently focused on and targeting the $0.50 price level. However, a small upper shadow on the most recent candlestick suggests that bearish sentiment may persist near this resistance.
Technical indicators, particularly the Bollinger Bands, indicate a consolidating price action around the $0.40 level, but with increased volatility. The Relative Strength Index’s rapid ascent reflects the erratic price movement. The condition of this crypto signal may pose challenges to breaking above the $0.50 price target, unless a more stable price environment emerges near this key level.
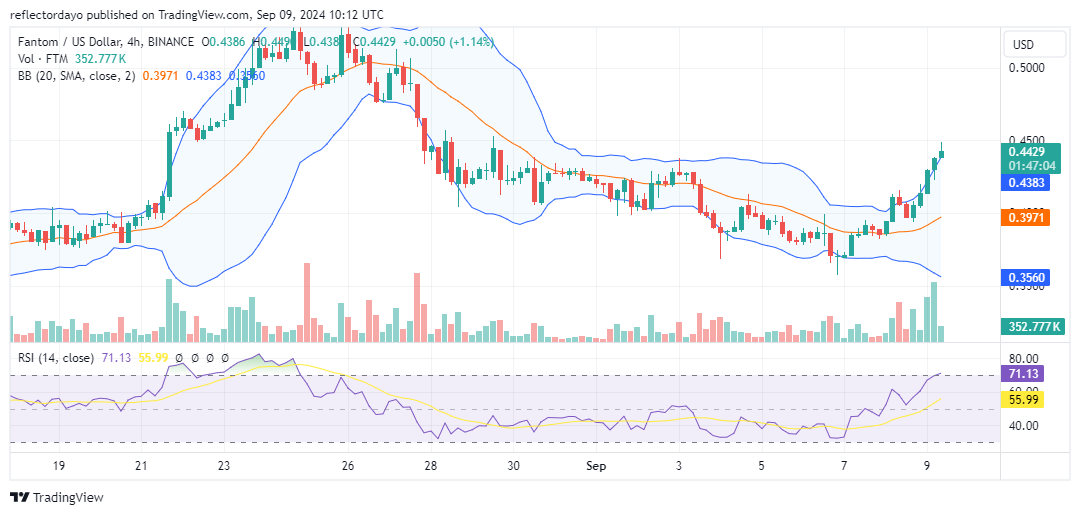
FTM/USD Price Prediction: 4-Hour Chart Analysis
As Fantom approaches the $0.50 price target, the $0.45 level presents a potential area of resistance. The recent formation of a shooting star candlestick pattern at this level suggests a potential bearish reversal.
From a shorter-term perspective, several indicators support this possibility. Both the Bollinger Bands and the Relative Strength Index are currently indicating overbought conditions, suggesting a potential reversal. However, this reversal might be temporary, followed by a resumption of the upward trend.