Wall Street Memes (WSM) Trade Positively, Featuring Rises
Estimated Reading Time: 3 minutes
Don’t invest unless you’re prepared to lose all the money you invest. This is a high-risk investment and you are unlikely to be protected if something goes wrong. Take 2 minutes to learn more

Wall Street Memes Price Prediction – February 26
In a bid to attempt to prolong a systemic baseline preparation in the trading activities that paired Wall Street Memes coin with the purchasing weight of the US dollar, the current financial situation is now positively arranged, featuring rises above the point of $0.001.
Currently, it appears that the influence of both bears and bulls will be minimal, as the market is likely to experience subdued price action in the coming sessions. However, this sentiment does not rule out the potential for more stable declines over the months ahead.
WSM/USD Market
Key Levels
Resistance levels: $0.002, $0.0025, $0.003
Support levels: $0.001, $0.0008, $0.0006
WSM/USD – 4-hour Chart
The medium-term chart (4-hour chart) of the WSM/USD market is positively staged, featuring rises in its signal potency.
A line of sideways is in the action, according to the manner of events that has defined candlesticks. Following alignment with that outcome, the Bollinger Bands indicators have continued to spread eastward, maintaining $0.0015 as the primary focus zone. As they approach the zones of 80, the stochastic oscillators are in the mood to veer north.
Will the US dollar put more forces on the Wall Street Memes coin in the near time as the price is in ranges around the Bollinger Bands?
Looking at the technical placement settings of the trend lines of the Bollinger Bands over a couple of sessions, it is practically demonstrated that the WSM/USD market has reached considerably reduced zones that long-term needed to continually build points ahead of potential rebounds, as the current financial outlook appeared positively, featuring rises in inputs.
The lower trend line of the Bollinger Bands has kept the WSM/USD market stable, creating opportunities for executing long positions. Buyers should consider increasing their position sizes.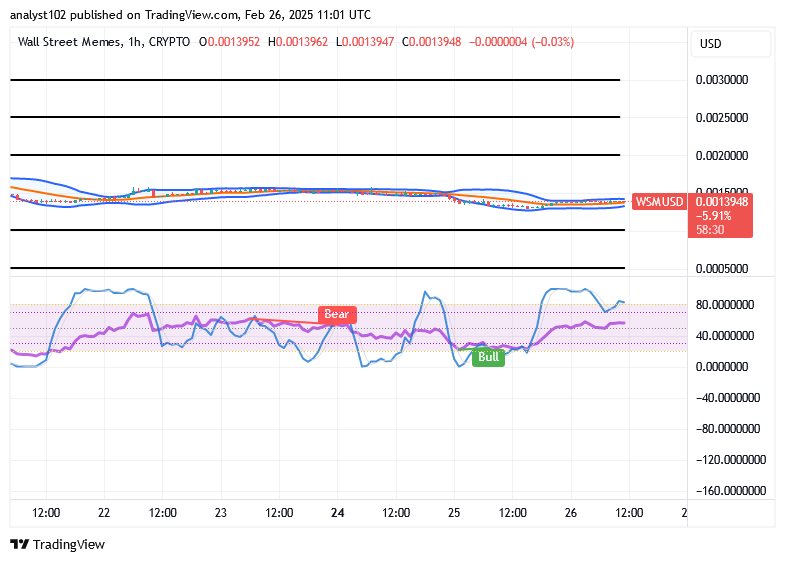
WSM/USD 1-hour chart
The 1-hour chart from the technical picture of the short-term setup showcases that the WSM/USD market is positively arranged, featuring rises in its inputs.
As of the current analysis based on the hourly chart, the stochastic oscillators have moved southward into the overbought region, suggesting that bullish momentum may be losing steam. This indicates that bulls should consider consolidating their positions to allow for stable, sustainable price increases in subsequent sessions. Meanwhile, the Bollinger Bands are tightly compressed around the $0.0015 level, with lower highs observed in the majority of candlestick formations, reflecting potential resistance and a constricted volatility environment. This setup may signal the market’s need for a pullback or sideways consolidation before resuming any upward movement.
That’s the objective, haha.
That’s the goal lol pic.twitter.com/jhUDCVnIKZ
— Wall Street Mav (@WallStreetMav) February 26, 2025
Buy and stake WSM now!: Wall Street Meme (WSM)