Wall Street Memes (WSM) Price Bounces, Showing Spikes
Estimated Reading Time: 4 minutes
Don’t invest unless you’re prepared to lose all the money you invest. This is a high-risk investment and you are unlikely to be protected if something goes wrong. Take 2 minutes to learn more

Wall Street Memes Price Prediction – February 25
As of the time of analytics, buyers are subjected to softening pedals on a tentatively moving mode to further prolong the opportunities of dip buys, as the WSM/USD market bounces, showing spikes in the processes.
The bottom portion of the Bollinger Bands indicators currently represents the systemic approach that has been producing consistent momentum buildup. And since a comeback is expected to happen soon, long-term position takers sought to avoid wasting time by gaining some points while that trade view remained in place.
WSM/USD Market
Key Levels
Resistance levels: $0.002, $0.0025, $0.003
Support levels: $0.001, $0.0008, $0.0006
WSM/USD – 4-hour Chart
The medium-term chart (4-hour chart) of the WSM/USD market bounces positively, showing spikes in most of its pricing motions.
The arrangement pattern of the trend lines of the Bollinger Bands has been that a repositioning posture has been made to create a flag shape for bulls to observe decent long entry position orders. The stochastic oscillators have traversed southbound into the oversold region, denoting the possibility note of seeing declines ending soon.
Are there signs that the WSM/USD market will continue to consolidate when oscillating tools enter an oversold area later on?
Having a prolonged series of fall-offs in the form of lower lows subsequently while the oscillating tools get into an oversold arena as regards the business deals of WSM/USD trade has never been to elongate more than necessary, given that the current financial trade stance shows that the price bounces, showing spikes.
The price action has shown a tendency to approach lower-bound levels in conjunction with key technical indicators, signaling a potential shift in market dynamics. This configuration warrants heightened vigilance among buyers, as the market remains susceptible to imminent volatility, which could trigger sharp reversals or “spring-ups.” Given the current positioning near the lower Bollinger Band, the prevailing bias suggests that most executed positions at this juncture are of the long (buy) type, reflecting the anticipation of a corrective rebound or trend reversal. Traders should remain alert to the risk of rapid price fluctuations, particularly if the indicators align to confirm a reversal signal.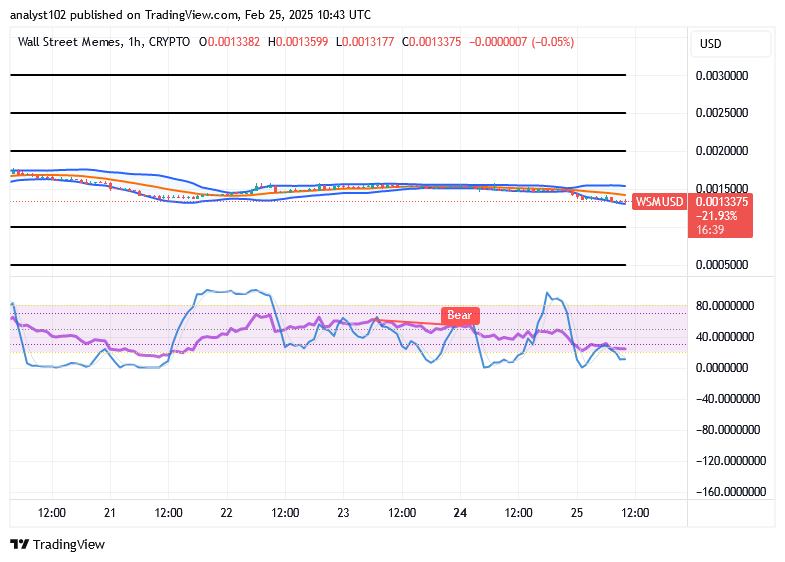
WSM/USD 1-hour chart
The 1-hour chart from the technical picture of the short-term setup showcases that the WSM/USD market bounces, showing spikes.
In the context of a bearish market structure, the stochastic oscillators are oscillating within the oversold region, indicating potential exhaustion of downward momentum. The Bollinger Bands have slightly expanded, signaling an increase in market volatility, while lower lows and lower highs are becoming more pronounced, suggesting a continuation of the prevailing downtrend. This setup may indicate a potential for further downward price action, with the market remaining under pressure unless key reversal signals emerge.
My parents at age 25: We ought to save money and purchase a home.
My parents at age 25: We ought to save money and purchase a home.
My parents at 25: We should save & buy a house
— Wall Street Memes (@wallstmemes) February 24, 2025
Me at 25: https://t.co/LOoJLSMsXR pic.twitter.com/llDFGOwnq6
Buy and stake WSM now!: Wall Street Meme (WSM)