Hedera Hashgraph (HBAR/USD) Bear Appears to Be Consolidating Around the $0.05 Price Level
Estimated Reading Time: 3 minutes
Don’t invest unless you’re prepared to lose all the money you invest. This is a high-risk investment and you are unlikely to be protected if something goes wrong. Take 2 minutes to learn more
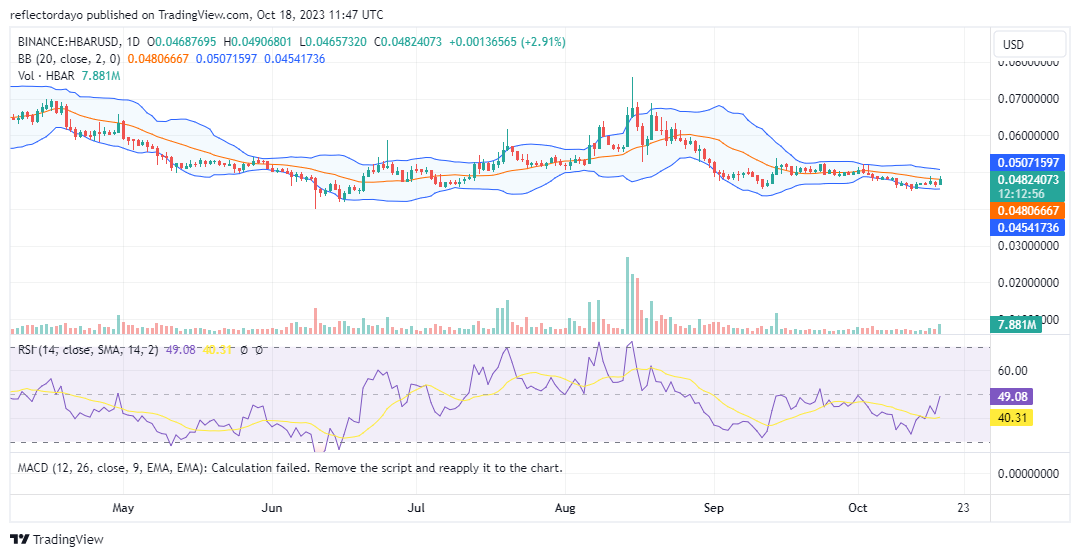
In the Hedera Hashgraph market, the demand side appears to exhibit responsiveness to the supply side. Even during periods of elevated market volatility, neither of these opposing market forces has significantly dominated the other. Nonetheless, in August, it became evident that the bullish trend temporarily held sway, pushing the price to a high of $0.076, only to subsequently retrace to the $0.05 price range.
Hedera Hashgraph Market Data
- HBAR/USD Price Now: $0.048
- HBAR/USD Market Cap: $1,610,919,921
- HBAR/USD Circulating Supply: 33,531,516,660 HBAR
- HBAR/USD Total Supply: 50,000,000,000 HBAR
- HBAR/USD CoinMarketCap Ranking: #30
Key Levels
- Resistance: $0.05, $0.055, and $0.060.
- Support: $0.04, $0.035, and $0.030.
Hedera Hashgraph Price Prediction: Analysis of Key Indicators
As Hedera Hashgraph market volatility abates in September, the price swings around the $0.05 level have noticeably contracted, leading to a consolidation phase within the market. The Bollinger Bands confirm this by depicting a narrow price channel aligned with the $0.05 level. While the market remains in a sideways range, the Relative Strength Index indicates a growing bearish influence, with bullish attempts to halt further declines. Since September, the Relative Strength Index has predominantly displayed downward movements with limited upward trends. However, in today’s market activity, a notable surge in investor interest to buy has driven the trade volume histogram higher than previous days.
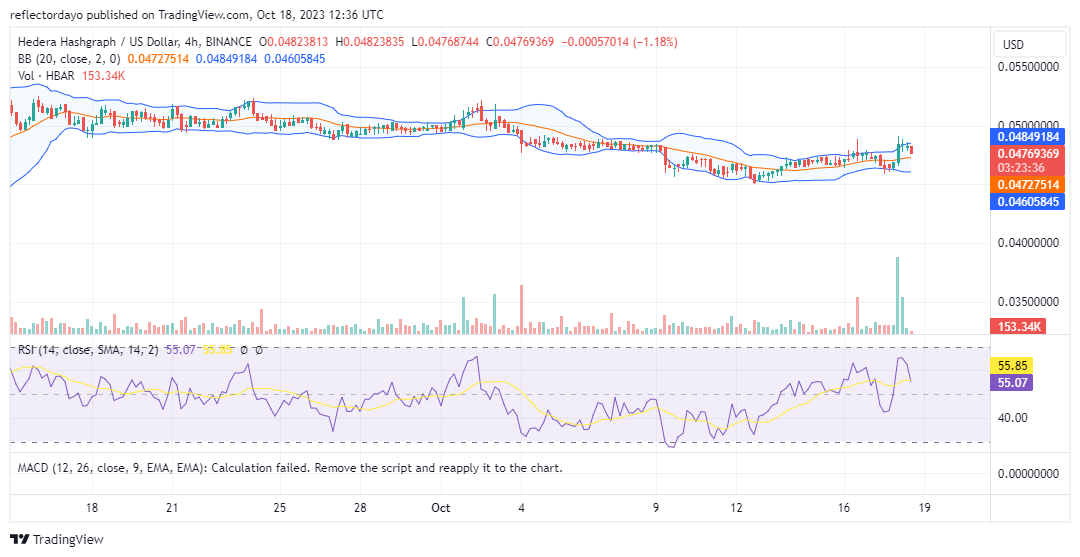
HBAR/USD 4-Hour Chart Outlook
During the initial 4-hour trading session today, a substantial surge in bullish momentum briefly appeared, potentially altering the market’s trajectory towards an upward trend. However, this bullish rally was short-lived. As the market approached the $0.05 price threshold, a standoff ensued between the bulls and bears, resulting in a reduction in market volatility. It is conceivable that the market could continue consolidating below the critical $0.05 price level. Should the market persist below this level, it would confirm the vulnerability of the bullish position to bearish pressure. Failure to overcome this crucial resistance may lead to further market decline.