Ethereum (ETH/USD) Market Consolidates Closely Below $3,000
Estimated Reading Time: 3 minutes
Don’t invest unless you’re prepared to lose all the money you invest. This is a high-risk investment and you are unlikely to be protected if something goes wrong. Take 2 minutes to learn more

Free Crypto Signals Channel
Ethereum Price Prediction – March 21
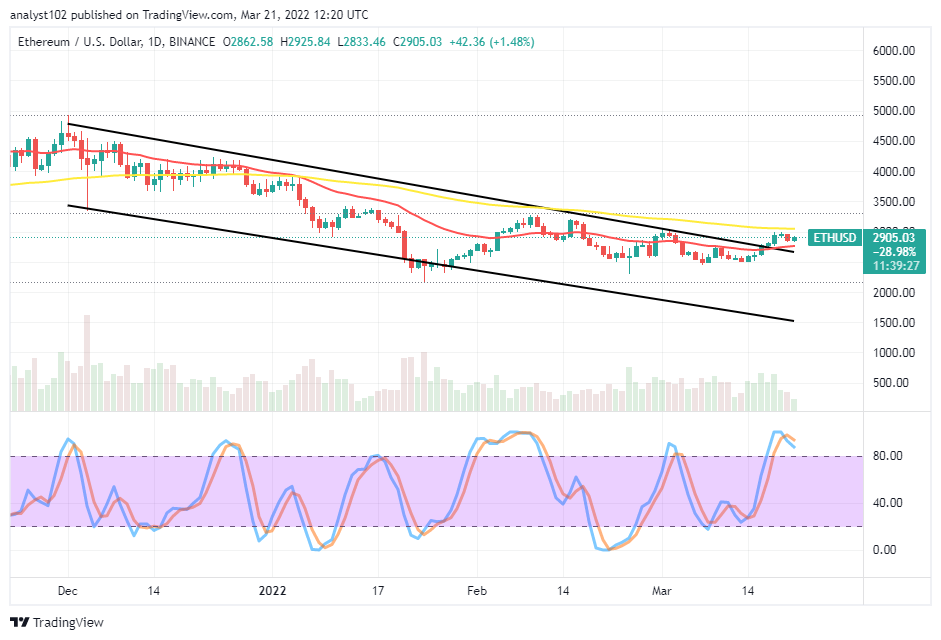
Some ups and downs have continued to feature in the ETH/USD trade activities as the crypto-economic market consolidates closely below the $3,000 line. The business transactions between ETH and the USD have featured between $2,925 and a low of $2,833. Price records a positive percentage of 1.48.
ETH/USD Market
Key Levels:
Resistance levels: $3,250, $3,500, $3,750
Support levels: $2,750, $2,500, $2,250
ETH/USD – Daily Chart
The ETH/USD daily chart shows the crypto-economic market consolidates closely below $3,000. The bigger SMA trend line is closely above the value-point to affirm its solidity. The 14-day SMA indicator is underneath the 50-day SMA indicator. Variant candlesticks now emerge between the SMAs. The Stochastic Oscillators are in the overbought region with their lines crossed within. And they may soon be attempting to point to the south direction firmly.
What is the ETH/USD trading situation like as the crypto-economic market consolidates closely below $3,000?
The ETH/USD trading situation appears not losing momentum to the downside in a hurry as the crypto-economic market consolidates closely below $3,000. Long-position takers may only be playing safer if buying orders had been taken down below the 14-day SMA trend line during the last sessions some days back. But, for buyers to exert positions stands the risk of losing to the downside.
On the downside of the technical analysis, the ETH/USD trade short-position placers would have to get re-positioning around the current price and higher resistance of $3,250 to observe a decent sell entry afterward. The use of smaller time-frames such as 1-hour or 4-hour will play a role in determining timely reliable entries. Traders should also the lookout for active motions before order executions.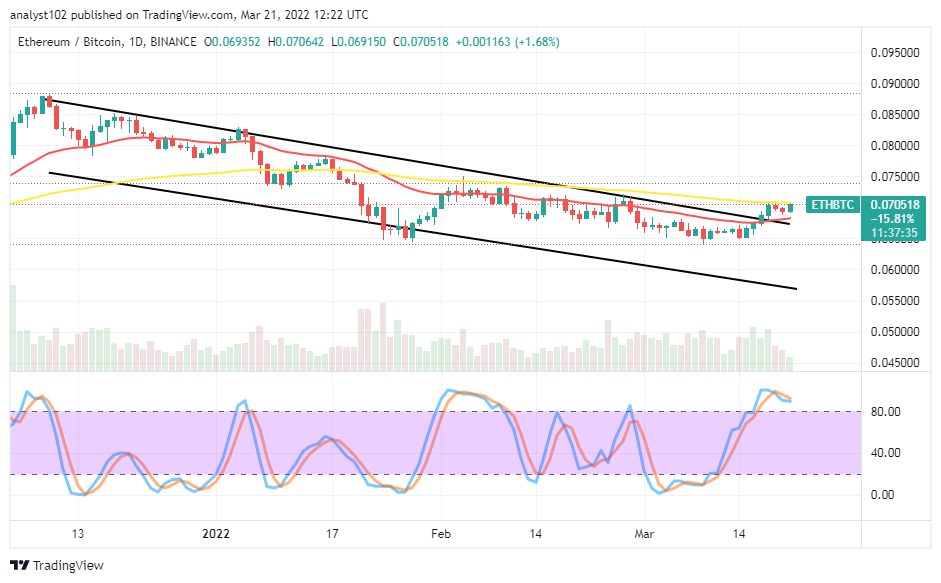
ETH/BTC Price Analysis
In comparison, Ethereum appears to be striving in its pushes against Bitcoin. The cryptocurrency pair market consolidates closely below the trend line of the bigger SMA. The 14-day SMA indicator is underneath the 50-day SMA indicator. The Stochastic Oscillators are in the overbought region. And, they closed their lines within. A smaller bullish candlestick is in the making to showcase the base crypto hasn’t weakened totally in its trending efforts against the purchasing valuation of the flagship crypto in the crypto world of business operations.
Note: Cryptosignals.org is not a financial advisor. Do your research before investing your funds in any financial asset or presented product or event. We are not responsible for your investing results.
You can purchase Lucky Block here. Buy LBlock: