Bitcoin Cash (BCH/USD) Market Downsizes, Averaging $300
Estimated Reading Time: 3 minutes
Don’t invest unless you’re prepared to lose all the money you invest. This is a high-risk investment and you are unlikely to be protected if something goes wrong. Take 2 minutes to learn more
Bitcoin Cash Price Prediction – January 21
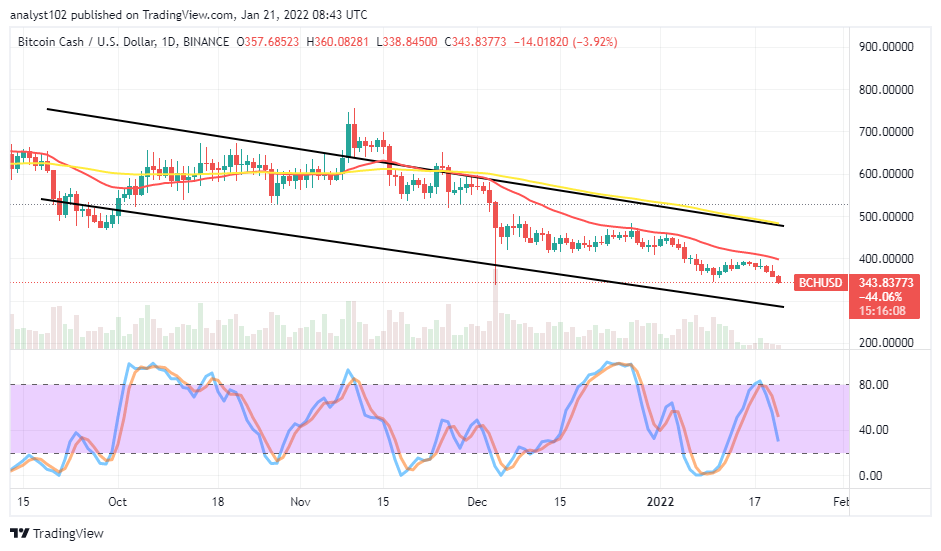
The BCH/USD market downsizes, averaging a $300 lower trading line in the bid to align with the current bearish cycle when the crypto-economic price failed to push northward past the $400 point in the recently attempted recovery movement. As of writing, the market’s percentage is rated at about 3.92, trading around $343.
BCH/USD Market
Key Levels:
Resistance levels: $400, $500, $600
Support levels: $300, $250, $200
BCH/USD – Daily Chart
The BCH/USD daily chart showcases the crypto-economic market downsizes, averaging $300 underneath the SMA downward trending lines. The 50-day SMA indicator tightly trends alongside the upper bearish trend line drawn above the 14-day SMA indicator. The lower bearish trend line drew southward to get positioned around the value line mentioned earlier, placing a mark on the spot as the maximal point the current falling force may push before getting exhaustion in the long run. The Stochastic Oscillators have crossed their lines southbound closely above the range of 20. That signifies the probability of the crypto economy going systemically southward as traded with the US Dollar.
Will there be rebounding forces soon as the BCH/USD market downsizes, averaging $300 level?
There’ll be rebounding forces expectantly while the BCH/USD price valuation drops to around $300 as the crypto-economic market downsizes, averaging the value line. With that said, long-position takers would have to exercise some degree of patience, as usual, to get to know when there be a decent rebounding signal before deciding to launch an order to avoid an unnecessary whipsawed trading situation.
On the downside of the technical analysis, the BCH/USD market short-position takers have to be wary of late entries even though bearish motions are, now having the dominance of the crypto economies on a general belief grand. Going by the present trading status, it may not be too psychologically good to launch more sell orders as even a bearish candlestick appears to be in the making. 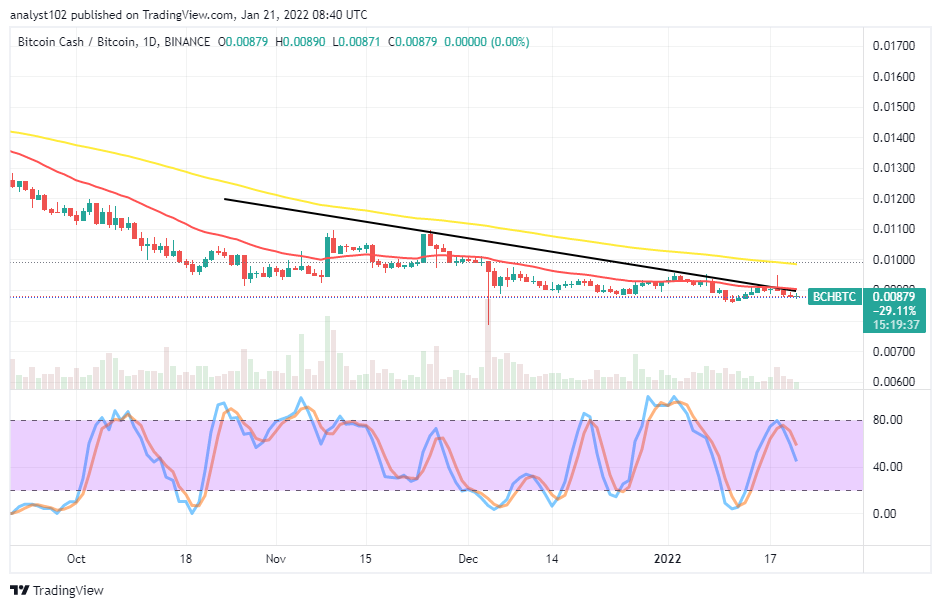
BCH/BTC Price Analysis
In comparison, the Bitcoin Cash’s trending outlook as paired with Bitcoin still suffers under a depressive force enforced on it by its counter trading instrument over a couple of several months until now. The 14-day SMA trend line is beneath the 50-day SMA trend line. The bearish trend line drew to align with the smaller SMA at the end. The Stochastic Oscillators have crossed southbound closer to the range of 40. That affirms the potentiality of seeing the base crypto pushing downward to lose capacity as paired with the most valuable counter crypto in the subsequent operations for some time.
Note: Cryptosignals.org is not a financial advisor. Do your research before investing your funds in any financial asset or presented product or event. We are not responsible for your investing results.
You can purchase crypto coins here. Buy Tokens