Litecoin (LTC/USD) Market Keeps a Pause at $90
Estimated Reading Time: 3 minutes
Don’t invest unless you’re prepared to lose all the money you invest. This is a high-risk investment and you are unlikely to be protected if something goes wrong. Take 2 minutes to learn more
Litecoin Price Prediction – January 24
Indecision has been playing out in the LTC/USD trade operations for a few days now, as the crypto market maintains a pause around $90 in an otherwise upward trend. k. Buying is keeping a pace at $90.284687 points, keeping a minute positive percentage rate of 0.42. That said, the situation seems to produce a reluctant precipitation-moving process toward the $80 support level at a close spot.
LTC/USD Market
Key Levels:
Resistance levels: $95, $100, $105
Support levels: $75, $70, $65
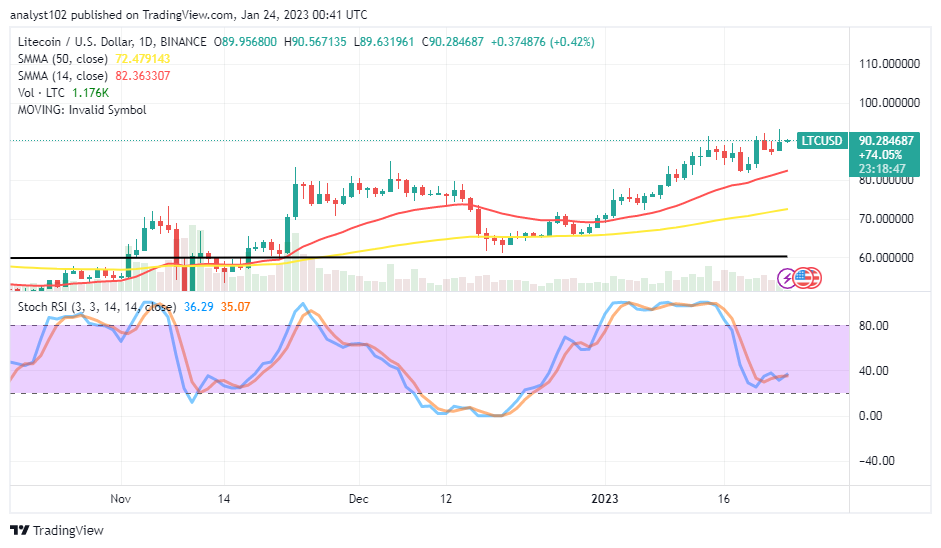
LTC/USD – Daily Chart
Today’s LTC/USD daily chart showcases that the crypto-economic market keeps a pause around the $90 trading axis, running into a few sessions. The the14-day SMA trend line is at $82.363307 above the $772.479143 value line of the 50-day SMA trend line. And they are underneath the variant trading candlesticks, pointing northward direction. The Stochastic Oscillators have traversed southbound from the overbought region to clog between 20 and 40, keeping 35.07 and 36.29 levels.
What may traders think if the price breaks down against the 14-day SMA?
It will be a session of a bearish-trading confirmation for the coming back of sellers in the LTC/USD trade operations if a bearish candlestick eventually occurs against the 14-day SMA’s point as the crypto market keeps a pause around the $90 value line. However, that technical protection may not come to pass very quickly. Long-position takers may buy back into the market between the dip spaces of the $80 and $70 levels when an active rebound is spotted.
As said in the preceding paragraph, on the technical sell-off trading route of the analysis, a bearish candlestick must appear against the smaller SMA trending indicator to the south side to establish a sell wall against the following candlesticks to fall further afterward. At this point, the Stochastic Oscillators must play a role in determining whether to enter decent shorting trades, especially when they are at higher levels, implying a cross to the southern side later.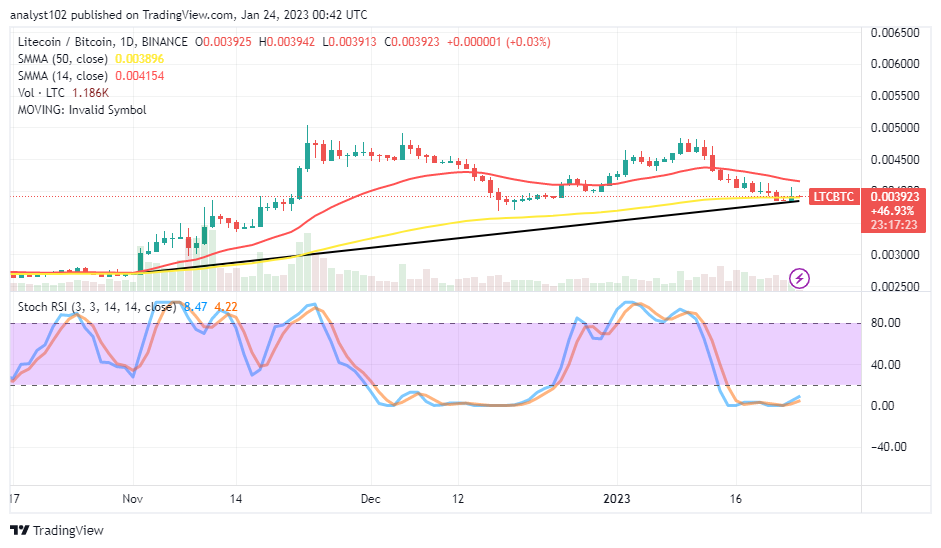
LTC/BTC Price Analysis
In comparison, Litecoin still appears, succumbing to a light correction pairing with the trending weight of Bitcoin on the daily chart. The duo crypto-economic market keeps a pause around the trend line of the bigger SMA. The 14-day SMA indicator is above the 50-day SMA indicator. The bullish trend line manages to draw, backing the bigger SMA at a psychological basepoint. The Stochastic Oscillators are in the oversold region, with the red line at 4.22 and the blue line at 8.47, indicating that an upsurge is on the way.
Note: Cryptosignals.org is not a financial advisor. Do your research before investing your funds in any financial asset or presented product or event. We are not responsible for your investing results.
You can purchase Lucky Block here. Buy LBLOCK