Litecoin (LTC/USD) Price Valuation Hits Resistances at $90
Estimated Reading Time: 3 minutes
Don’t invest unless you’re prepared to lose all the money you invest. This is a high-risk investment and you are unlikely to be protected if something goes wrong. Take 2 minutes to learn more
Litecoin Price Prediction – January 17
It has been that the LTC/USD market valuation hits resistances around the trading axis of $90 after a long-strong-holding move in rallies. The transaction outlook has led to high and low points between $86.614250 and $84.665493. As this article is being written, the price trades at an average minute 0.33 percentage rate, keeping the value line of $85.685647. All that observations showcase buying spree has been put to a check, having reached around the point in question.
LTC/USD Market
Key Levels:
Resistance levels: $90, $95, $100
Support levels: $75, $70, $65
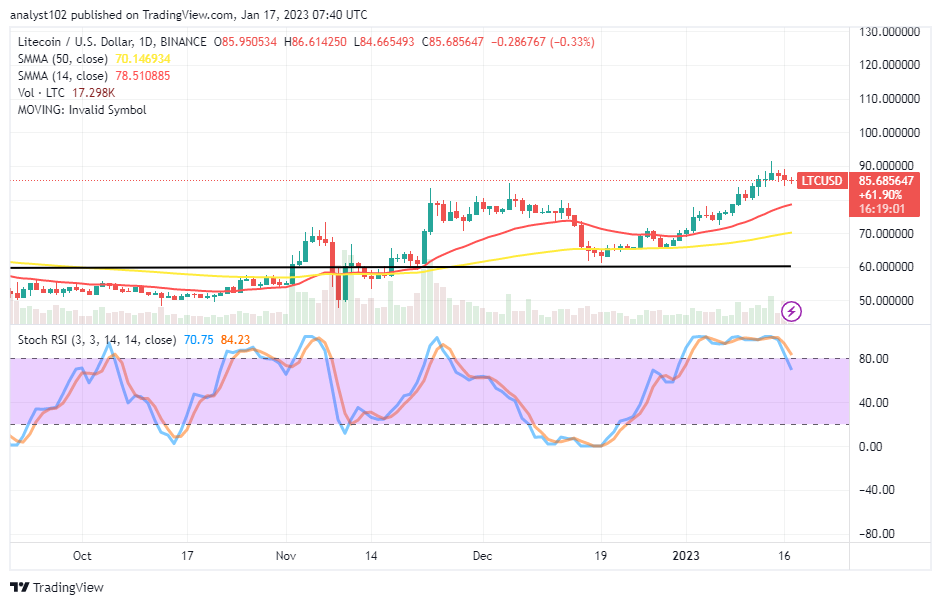
LTC/USD – Daily Chart
Today’s LTC/USD daily chart reveals the crypto’s price valuation hits resistances around $90 over the buying signal side of the SMA trend lines. The 14-day SMA indicator is at $78.510885 above the $70.146934 point of the 50-day SMA indicator. The Stochastic Oscillators have crossed southbound in the overbought region to 84.23 and 70.75 levels. A line of variant bearish trading candlesticks has piled up to signify that a declining move is in the offing around the first resistance line mentioned above.
Is it technically appropriate to maintain a purchase order around the LTC/USD market level of $90?
Expectantly, a series of bearish candlesticks has occurred around the $90 resistance to suggest the need for long-position placers to suspend further longing of orders as the LTC/USD price valuation hits resistances around it in the recent fewer past days. Even if there will be a need for a sudden push past the area of the barrier line in the near time, it may be to cause a whipsawed session against the newly intended longing position at that bargaining capacity level afterward.
On the sell-off trading route of the technical analysis, the selling entry point has been observed around the $90 resistance, running for about three days. Short-position holders may now consider launching a sell order with a stop loss order between $95 and $100 if that feeling continues to hold fruitfully. An instant execution order has to use in carrying that suggested tradeable order. An eventual reading posture of the Stochastic Oscillators at lower-trading zones that can lead to their pointing northbound, in the long run, will decimate the potential effect of the US Dollar.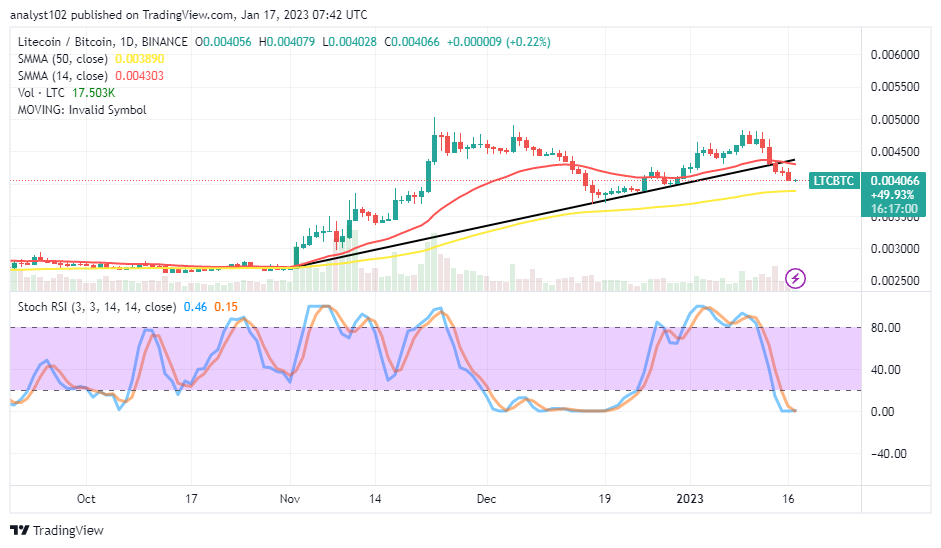
LTC/BTC Price Analysis
In comparison, Litecoin’s trending outfit is in a correction, placing a high-pushing force against Bitcoin’s worth. The 14-day SMA indicator with the bullish trend line drawn has breached southward, aiming to extend the motion toward the 50-day EMA indicator underneath them. The Stochastic Oscillators have dipped southbound into the oversold region to keep 0.15 and 0.46 levels. As it is, a bullish candlestick needs to emerge before nursing the possibility of the base crypto possessing the potency of regaining the stances against its counter-trading crypto.
Note: Cryptosignals.org is not a financial advisor. Do your research before investing your funds in any financial asset or presented product or event. We are not responsible for your investing results.
You can purchase Lucky Block here. Buy LBLOCK