Litecoin (LTC/USD) Market Booms to Push Through Resistances
Estimated Reading Time: 3 minutes
Don’t invest unless you’re prepared to lose all the money you invest. This is a high-risk investment and you are unlikely to be protected if something goes wrong. Take 2 minutes to learn more
Litecoin Price Prediction – January 10
A firm consolidation of the LTC /USD trade activities has metamorphosed into an increasing mode as the crypto market booms to push through resistances to surpass a previous spot of convergences. Price possesses a minute positive percentage rate of 0.88 to trade between $82.846430 and $81.597733 as of writing. Some anticipation of selling modes, which should have returned at the current trading capacity, is losing ground to the buying speed.
LTC/USD Market
Key Levels:
Resistance levels: $85, $90, $95
Support levels: $75, $70, $65
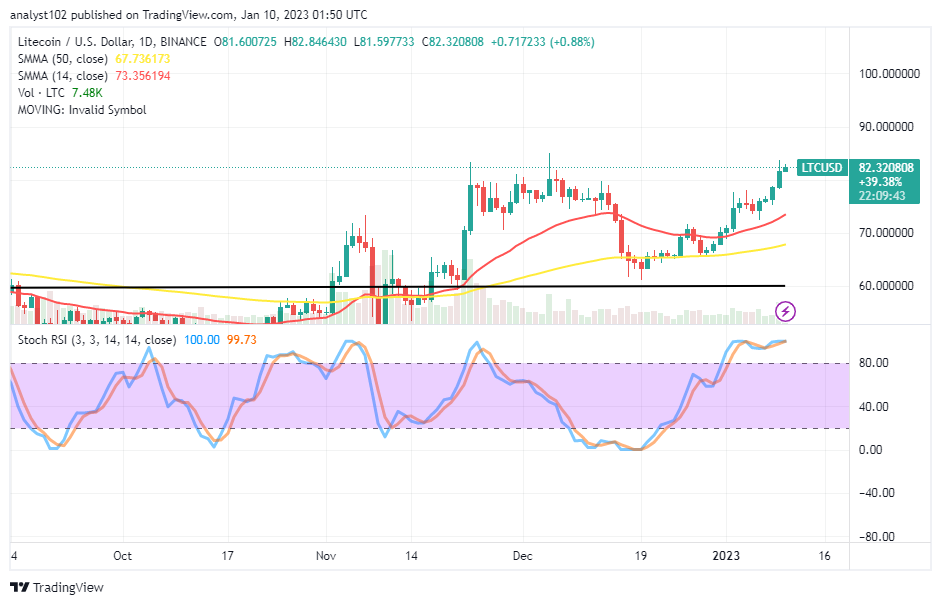
LTC/USD – Daily Chart
Today’s LTC/USD daily chart showcases the crypto market booms to push through resistances where a chain of confluences had taken place in the operations between November 24 and December 14 trading days of the last year. The 14-day SMA trading indicator is at $73.356194 above the 50-day SMA indicator, which is at $67.736173. The Stochastic Oscillators are in the overbought region, firmly holding positions in the path of a northbound manner to affirm the presence of bulls in the crypto economy presently.
Will a bearish emerging candlestick at any point in the LTC/USD trade be sufficient for the bears to count?
A sudden bearish emerging candlestick at any point in the LTC/USD trade will potentially produce a strong signal against getting more sustainable increases in the crypto’s valuation as it booms to push through resistances far above the trend lines of the SMAs. At this point, long-position placers need to be cautious of fresh execution of longing orders to escape from a situation that can cause an abrupt fall-off situation emanating from the condition of an overbought outlook afterward.
A bearish trading candlestick must appear on the sell-off path of the technical analysis to confirm the possibility of bears coming back in the LTC/USD market activities. Once the anticipated candlestick appears, sellers will need to use the top end to determine a stop-loss order to protect themselves from potential swift upsurges. A further, sharper indication that sellers have fully taken over control of the market will be the breaking of the 14-day SMA indicator to the negative.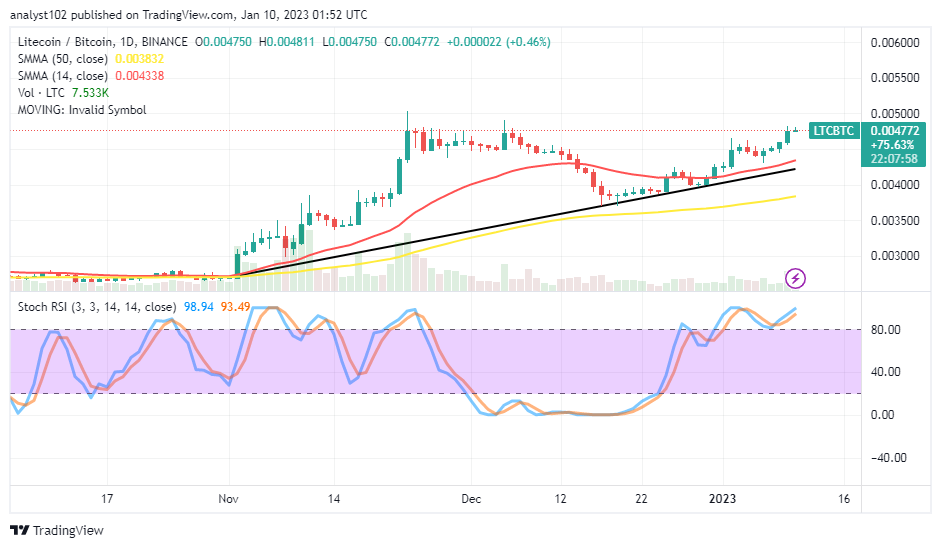
LTC/BTC Price Analysis
In comparison, Litecoin’s trending ability has continued to stand firmer through the pathway of the north against Bitcoin over a couple of sessions. In other words, the former crypto’s price booms to push through resistances, pairing with its latter trading instrument over the trend lines of the SMAs. The 14-day SMA indicator is above the 50-day SMA indicator. The Stochastic Oscillators are in the overbought region, pointing northbound at 93.49 and 998.94 levels to signify that some uprisings are ongoing between the duo cryptos as of the time of writing this analysis.
Note: Cryptosignals.org is not a financial advisor. Do your research before investing your funds in any financial asset or presented product or event. We are not responsible for your investing results.
You can purchase Lucky Block here. Buy LBLOCK