ChainLink (LINK/USDT) Sees a Sharp Drag Down
Estimated Reading Time: 3 minutes
Don’t invest unless you’re prepared to lose all the money you invest. This is a high-risk investment and you are unlikely to be protected if something goes wrong. Take 2 minutes to learn more

Chainlink Long-term Analysis: Bullish
Chainlink is currently in a strong uptrend but experiencing a pullback after a significant surge in price. However, the formation of the red candlestick close to $21.91 suggests a temporary correction due to a minor profit-taking phase.
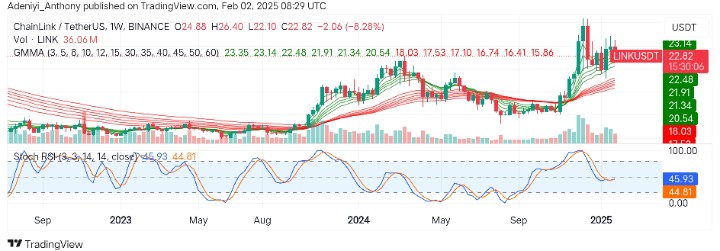
Recently, Chainlink surged to $26.40 before retracing back by 8.28%, indicating active bearish activities in the Short term.
To this end, the Guppy Multiple Moving Averages (GMMAs) and the mid-line suspended Stochastic RSI suggest the price prepares to resume a bullish trend or chart a new course.
Currently, Chainlink trades at $22.82, recording 36.06 million weekly trades.
Technical Indicators
Major Resistance Levels: $26.40, $30.00, and $35.00
Major Support Levels: $21.91, $20.50, and $18.00
Chainlink Technical Analysis
The analysis of chainlink against the Tether on the weekly timeframe shows that the pair is experiencing a sharp dip despite being in a bullish position.
The GMMAs show that the short-term EMAs are well above the investor’s EMAs, confirming a bullish outlook. However, to maintain momentum, the price needs to stay above immediate support at $21.91; otherwise, a dip below $21.90 might signal further downside movements.
LINK/USDT Analysis: Expectations
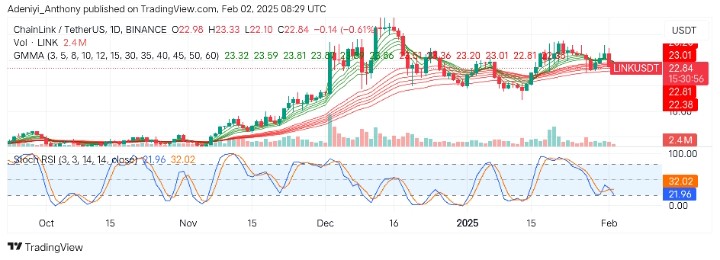
On the daily timeframe, LINK/USDT analysis shows that the price is struggling to break above immediate resistance while recording a dip of 0.61%.
The GMMAs show a general bullish structure as the short-term EMAs sit above the long-term EMAs in a downward manner. However, the current price’s position suggests consolidation as the GMMAs press together.
On the other hand, the Stochastic RSI signals an oversold condition for the pair, suggesting a potential reversal or bounce if buyers step in. Therefore, if the price holds at $22.50, $24.50 could be the next target; otherwise, the $20.00 support level would be tested again if the current support fails.
You can purchase crypto coins here. Buy LBlock