Chainlink (LINK/USDT) Shows Renewed Interest Towards $30.00 Critical Level
Estimated Reading Time: 3 minutes
Don’t invest unless you’re prepared to lose all the money you invest. This is a high-risk investment and you are unlikely to be protected if something goes wrong. Take 2 minutes to learn more

LINK/USDT Long-term Analysis: Bullish
The market for Chainlink against the Tether has been riding a wave of bullish momentum, reflecting strong market bullish sentiment characterized by a renewed interest at a psychological level.
Over the past weeks, LINK/USDT has steadily increased as seen in the increasing trading volume and heightened investor interest. However, with a gain of over 3% over the opening price, technical indicators are signaling more improvement to the North, though caution is needed as the price approaches a key level.
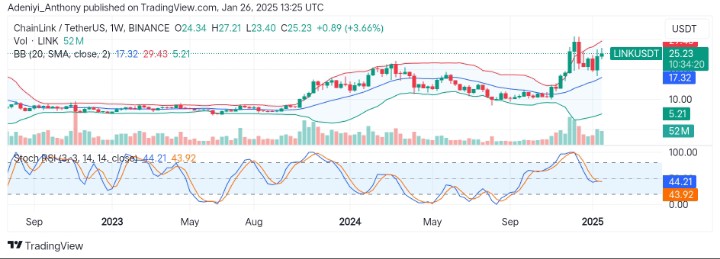
Currently, Chainlink trades at $25.23 between the upper segment of the Bollinger Bands, with 52 million traded volumes for the week.
Technical Indicators
Major Resistance Levels: $27.45, $30.00, and $35.00
Major Support Levels: $23.40, $17.32, and $10.00
Chainlink Technical Analysis
The price of Chainlink against the Tether on the weekly timeframe has been trading above the middle Bollinger band at $17.32 for some weeks, reflecting sustained bullish action despite the recent consolidation phase. However, with the bands widespread and the current uptick in price, a movement above $27.32 towards $30.00 may be possible in the near term.
On the other hand, the Stochastic RSI suggests the pair has more room to grow as the indicator’s lines sit in the neutral zone. This position suggests Chainlink might advance above the current resistance level, while a break above the 80-mark level may warrant caution.
To this end, with steadily increased investor participation, a breakout above the $27.32 level would be possible. Conversely, failure to hold above the current level may lead to retesting of previous supports.
LINK/USDT Analysis: Where from Here?
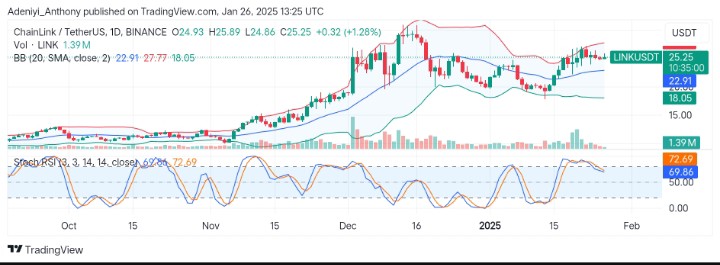
On the daily timeframe, LINK/USDT shows resilience in its uptrend while consolidating at $25.25, signifying an ongoing battle between the bulls and bears.
The price actions, on one hand, suggest a move towards the $27.00 level, leaning on the immediate dynamic level at $22.91, as the Bollinger expands for more volatile actions.
On the other hand, the Stochastic oscillator signals a gradual movement towards the overbought region, suggesting the pair might be correct in the short term.
To this end, traders must apply caution, as a break above $27.00 would indicate more bullish action; otherwise, a break below $22.77 might result in a short-term pullback towards previous support levels.
You can purchase crypto coins here. Buy LBlock