Litecoin (LTC/USD) Price Increases to $75 Psychological Resistance
Estimated Reading Time: 3 minutes
Don’t invest unless you’re prepared to lose all the money you invest. This is a high-risk investment and you are unlikely to be protected if something goes wrong. Take 2 minutes to learn more
Litecoin Price Prediction – January 3
Long-position placers in the LTC/USD market operations have had the upper hand against selling activities over a couple of days as the price increases to the $75 psychological resistance line. Todays’s trading zones have witnessed high and low values between $76.388930 and $74.410482 at a positive percent of 1.13.
LTC/USD Market
Key Levels:
Resistance levels: $80, $85, $90
Support levels: $70, $65, $60
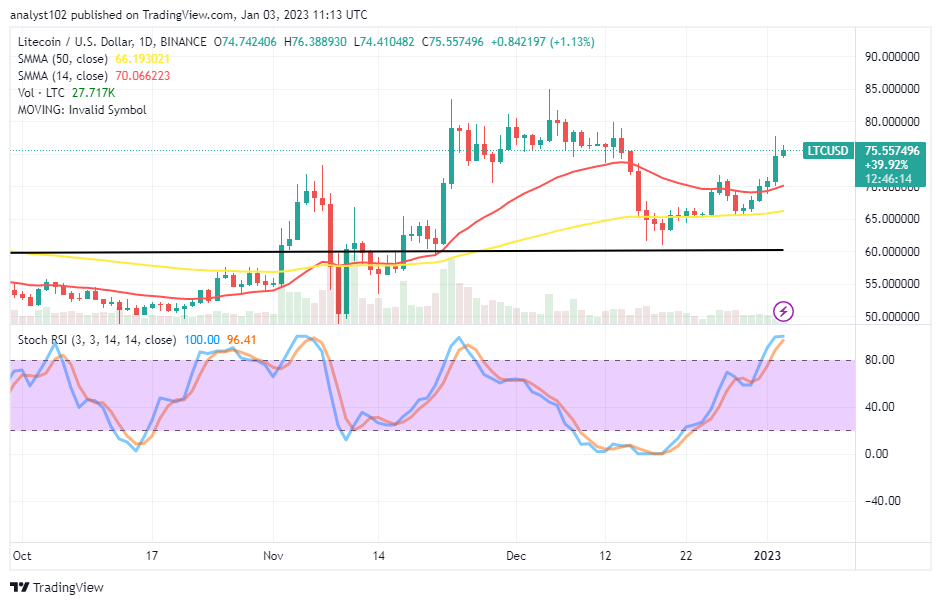
LTC/USD – Daily Chart
The daily chart reveals the LTC/USD trade price increases to $75 psychological resistance after been to surge through the barriers of the SMA trend lines recently. The 14-day SMA indicator is at $70.066223 over the $66.0193021 value line of the 50-day SMA indicator. The Stochastic Oscillators have moved into the overbought region to 96.41 and 100 levels. And they are seemingly trying to close their lines around those identified points to suggest that a pause will surface in the subsequent sessions.
What is the current reading position of the LTC/USD market movers?
The position of the LTC/USD market movers projects that bulls may soon be getting to push more for profits toward the resistance around $80 in the following operations as the crypto’s price increases to a $75 psychological value. That said, buyers may be acting in order systemically by exerting less-active pressure to make up for the completion of the current bullish-trading cycle before any possibility of giving back to an emergence of a bearish candlestick afterward.
On the declining side of the technical analysis, there will be a need for an occurrence of a bearish-trading candlestick wall around the resistances of $80 and $85 or, in the long run, below the lower resistance value to have the possibility of launching back a sell order. Sellers will have to back their entries with active price action, and also they need to put a stop-loss order after spotting a reversal pattern around those points.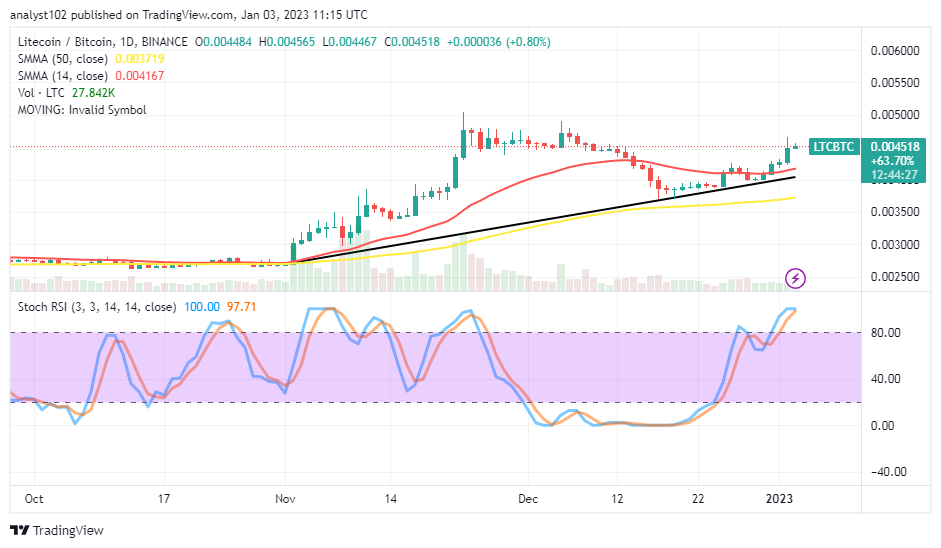
LTC/BTC Price Analysis
Litecoin has continually managed to hold a bullish outlook trend against the purchasing ability of Bitcoin to some reasonable extent over time. The pairing crypto’s price increases to a psychologically higher resistance point over the trend lines of the SMAs. The 14-day SMA indicator is above the 50-day SMA indicator. The Stochastic Oscillators have sprung northbound into the overbought region, maintaining 97.71 and 100 levels to indicate the base crypto has pushed to an exhaustion stage capable of losing the momentum back to its counter crypto.
Note: Cryptosignals.org is not a financial advisor. Do your research before investing your funds in any financial asset or presented product or event. We are not responsible for your investing results.
You can purchase Lucky Block here. Buy LBLOCK