Litecoin (LTC/USD) Market Is Likely to Halt at $70
Estimated Reading Time: 3 minutes
Don’t invest unless you’re prepared to lose all the money you invest. This is a high-risk investment and you are unlikely to be protected if something goes wrong. Take 2 minutes to learn more
Litecoin Price Prediction – December 27
In recent trading operations, Litecoin trade went down to find support around the $60 line, and its current pushing mode shows it is likely to halt around the $70 zone in the following activities for a while. As of writing this analytics write-up, the price maintains a minute negative percent of 0.73, trading at the $70.216846 value line.
LTC/USD Market
Key Levels:
Resistance levels: $75, $80, $85
Support levels: $65, $60, $55
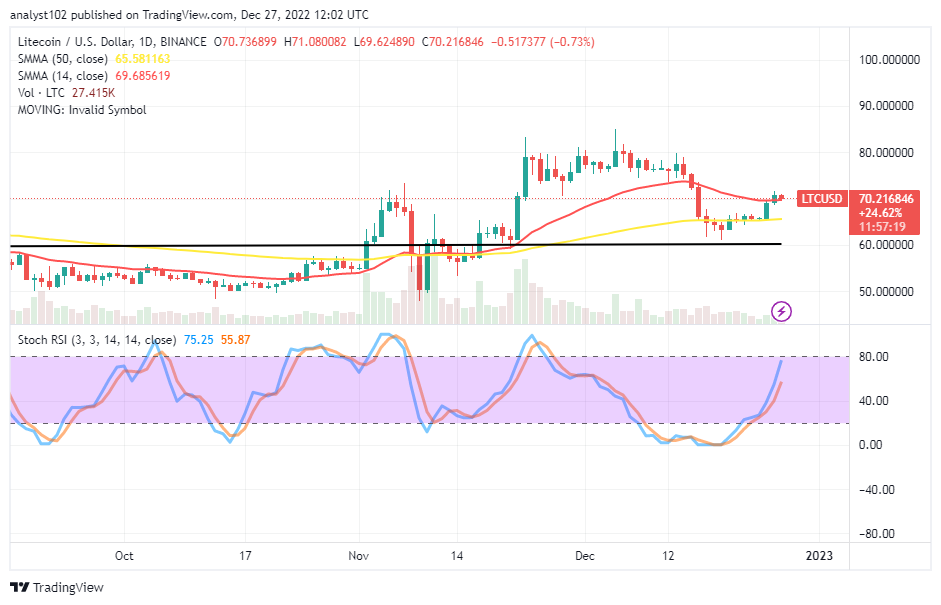
LTC/USD – Daily Chart
The LTC/USD daily chart showcases the crypto market is likely to halt operations around the $70 level, possibly for some time, in the medium or short-term running manner. The 14-day SMA indicator is $69.685619 above the $65.581163 value point of the 50-day SMA indicator. A smaller bearish trading candlestick is in the making, sounding a warning signal against the continuation of getting sustainable ups. The Stochastic Oscillators have traversed northbound from the lower range of the oversold region to 55.87 and 75.25 levels.
Will the LTC/USD market push for more ups reliably over the $70?
There has been a sign of active reversal-moving mode in the LTC/USD trade operation to suggest the crypto’s price is; likely to halt around the $70 level. For bulls to be able to maintain their breath over the trend line of the 14-day SMA, the current upward forces shouldn’t reverse shortly against the value line of the broader SMA trend line. It would be unethical technically inclined to launch a buying order during any possible sudden shoot-up at any trading capacity. Litecoin (LTC/USD) Market Is Likely to Halt at $70
On the downside of the technical analysis, the LTC/USD market bears and bulls are cautioning to exert active moves around the $70 trading spot. However, a smaller bearish candlestick in the making indicates that a scenario will soon change into a pattern that will succumb to several downturns. A slight crossing of the Stochastic Oscillators lines to the southbound will imply a better index toward getting a reliable sell-off at a particular point during an active move.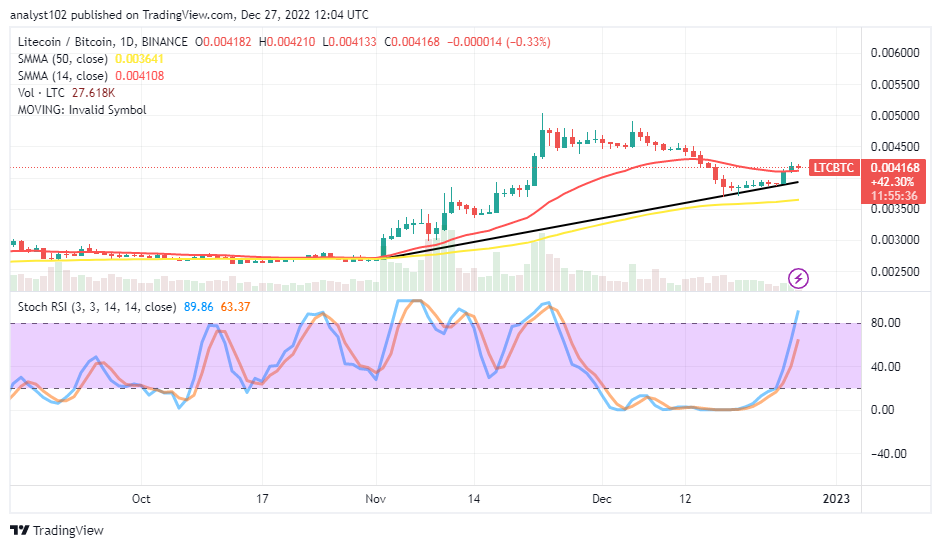
LTC/BTC Price Analysis
In comparison, Litecoin’s trending catalyst has embarked upon a recovery motion against the pushing force of Bitcoin around the smaller SMA trend line. The paired cryptocurrency had had a pullback, and it is impossible to disregard the possibility of a price halt around the 14-day SMA signal. The 50-day SMA indicator is noticeably underneath the smaller SMA. The Stochastic Oscillators have struggled to cross northbound from the oversold region to 63.37 and 89.86 levels. That signifies the base trading instrument has almost exhausted its trending weight against its counter-trading tool.
Note: Cryptosignals.org is not a financial advisor. Do your research before investing your funds in any financial asset or presented product or event. We are not responsible for your investing results.
You can purchase Lucky Block here. Buy LBLOCK