The XRP Market (XRP/USD) Rallies Back to Early April’s $0.55 Resistance Level
Estimated Reading Time: 2 minutes
Don’t invest unless you’re prepared to lose all the money you invest. This is a high-risk investment and you are unlikely to be protected if something goes wrong. Take 2 minutes to learn more
In mid-March, the XRP market broke out of a price consolidation trend around the $0.377 price level, and it was a very massive bullish breakout. Within a few days, the market was able to peak at $0.585 before traders began to take their profits. But because bulls were strong in this market, the market kept moving within the $0.5 and $0.42 price channels, and at the higher support level of $0.42, XRP was able to conserve 60% of its bullish gains.
XRP Market Data
- XRP/USD Price Now: $0.52
- XRP/USD Market Cap: $27,188,005,262
- XRP/USD Circulating Supply: 100,000,000,000
- XRP/USD Total Supply: 100,000,000,000
- XRP/USD Coinmarketcap Ranking: #6
Key Levels
- Resistance: $0.55, $0.60, and $0.65
- Support: $0.45, $0.43, and $0.4.
Price Prediction for the XRP Market: The Indicators’ Point of View
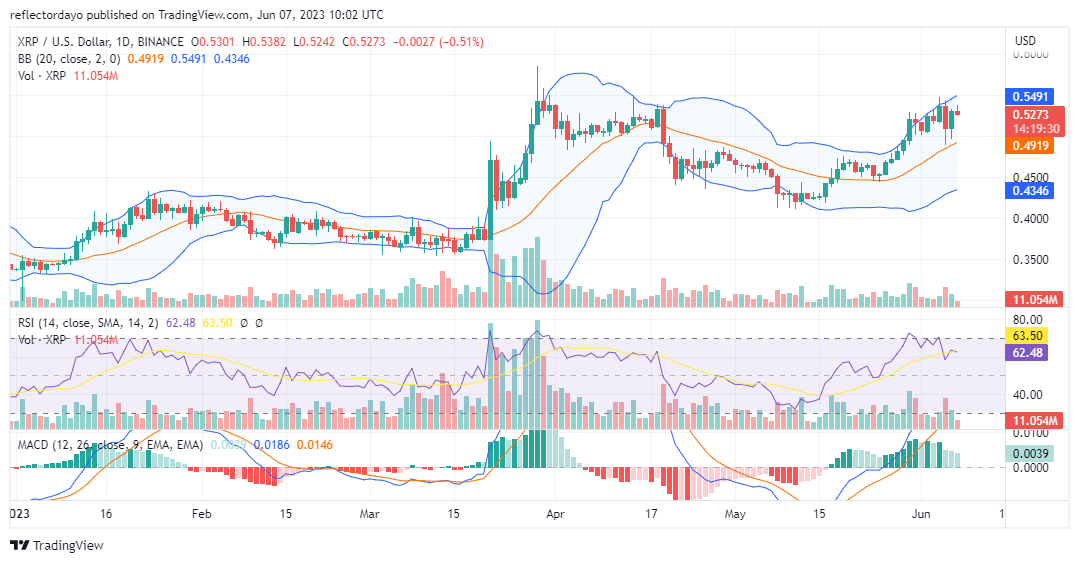
After a tense market struggle at the $0.42 price level, bulls became stronger to break the market out of the deadlock. The buying pressure began to increase in the second half of May, so much so that volatility seems to be one-sided. As the XRP market reached the $0.55 price level, bears began to respond. In the Relative Strength Index (RSI), the RSI line bounced off the edge of the 70-level oversold territory on three occasions, showing that there could be strong bearish sentiment around this level. But for now, in the daily chart, the market remains above the 20-day moving average; therefore, bulls still have the upper hand.
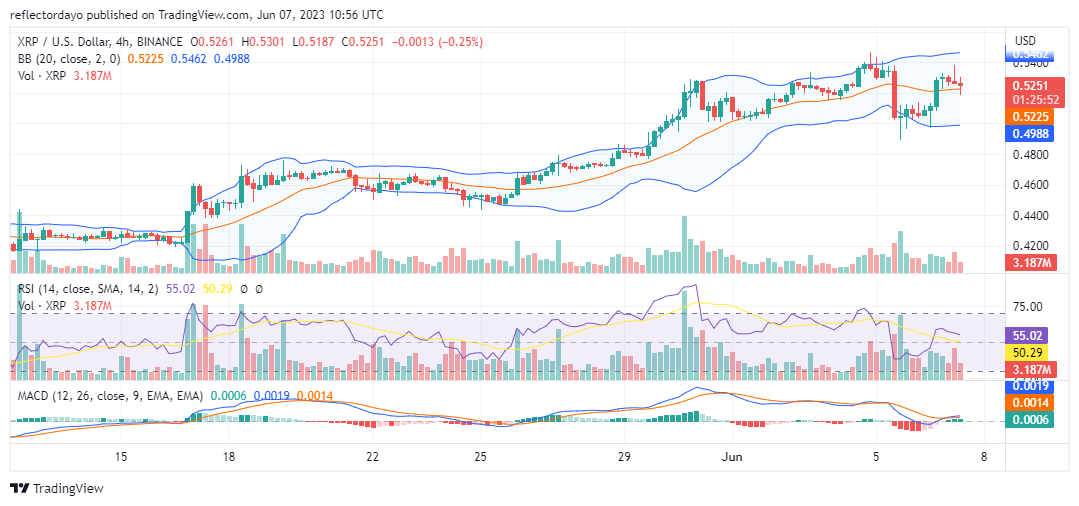
XRP 4-Hour Chart Outlook:
From a 4-hour session perspective, we see the price around the equilibrium level. The market at first became tense. In the second four-hour session of today’s market, we noticed a considerable amount of activity in the market, as portrayed by the trading volume indicator, but with a gravestone candlestick formation. This suggests a faceoff between demand and supply at the key resistance level. If buyers can keep the market at equilibrium a little longer, they might be able to wear off bearish sentiments, which may turn the market southward.