Lucky Block Price Prediction: LBLOCK/USD Touches $0.000160 Low; Buy the Dip Now
Estimated Reading Time: 3 minutes
Don’t invest unless you’re prepared to lose all the money you invest. This is a high-risk investment and you are unlikely to be protected if something goes wrong. Take 2 minutes to learn more
Lucky Block Price Prediction – November 12
The Lucky Block price prediction shows that LBLOCK is hovering around $0.000160 as the buying pressure gathers for the upside.
LBLOCK/USD Long-term Trend: Bearish (4H Chart)
Key Levels:
Resistance levels: $0.000200, $0.000220, $0.000230
Support levels: $0.000130, $0.000120, $0.000110
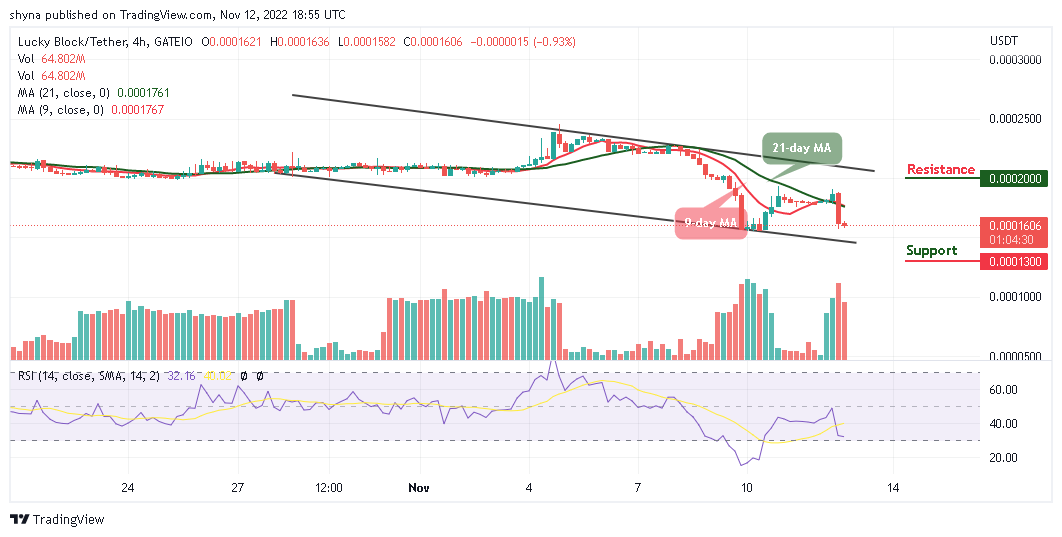
LBLOCK/USD is trading around $0.000160 as the coin gets ready for the upward movement. The current trend suggests that a bullish movement is coming into focus as soon as the coin crosses above the 9-day and 21-day moving averages. Therefore, both the new and the existing buyers are expected to invest more in the coin.
Lucky Block Price Prediction: LBLOCK/USD Will Head to the North
The Lucky Block price would begin to experience an increasing volume coupled with a bullish regroup in the positive direction. However, should the coin delay its bullish movement, the bears could become severe with more downs for the new investors to enter. However, the next levels of support could lie at $0.000130, $0.000120, and $0.000110.
According to the 4-hour chart, the Lucky Block price would move bullishly if the technical indicator Relative Strength Index (14) rebounds and cross above the 40-level. Meanwhile, the potential resistance levels at $0.000200, $0.000220, and $0.000230 will come to play if the coin trades bullishly.
LBLOCK/USD Medium-term Trend: Ranging (2H Chart)
The 2-hour chart shows that the Lucky Block price is moving below the 9-day and 21-day moving averages while the coin prepares for the bullish movement. However, should the market price break to the upside; it could begin an upward trend to touch the resistance level of $0.000200 and above.
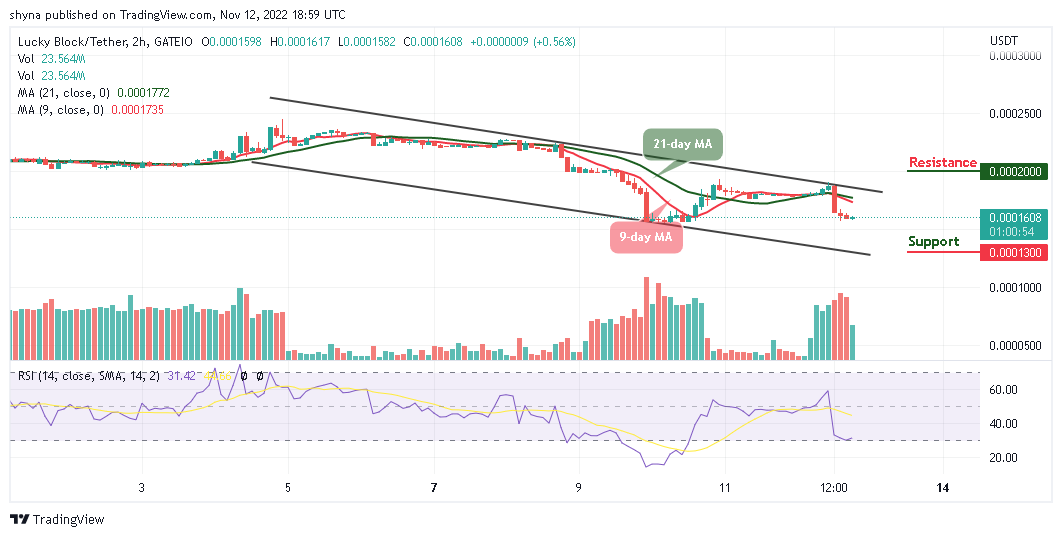
However, if the bulls put more pressure, LBLOCK/USD would cross above the upper boundary of the channel but on the contrary, the Lucky Block price can retreat and head towards the lower boundary of the channel to hit the support at $0.000130 and below. However, the technical indicator Relative Strength Index (14) trades around the oversold region, getting ready for a movement to the positive side.
You can purchase Lucky Block here. Buy LBLOCK