Dogecoin Price Prediction: DOGE/USDT Market Seeks Support Above the $0.1400 Level
Estimated Reading Time: 3 minutes
Don’t invest unless you’re prepared to lose all the money you invest. This is a high-risk investment and you are unlikely to be protected if something goes wrong. Take 2 minutes to learn more

Dogecoin Price Prediction for October 28
For the first time in about two months, price action in the Dogecoin market surfaced above the $0.1400 threshold nine sessions ago. Although the market briefly retreated below the $0.1400 threshold, it soon climbed back above it. Let’s explore how the coin may fare from here.
DOGE/USDT Long-term Trend: Bullish (Daily Chart)
Key Price Levels:
Resistance: $0.1500, $0.1600, $0.1700
Support: $0.1400, $0.1300, $0.1200
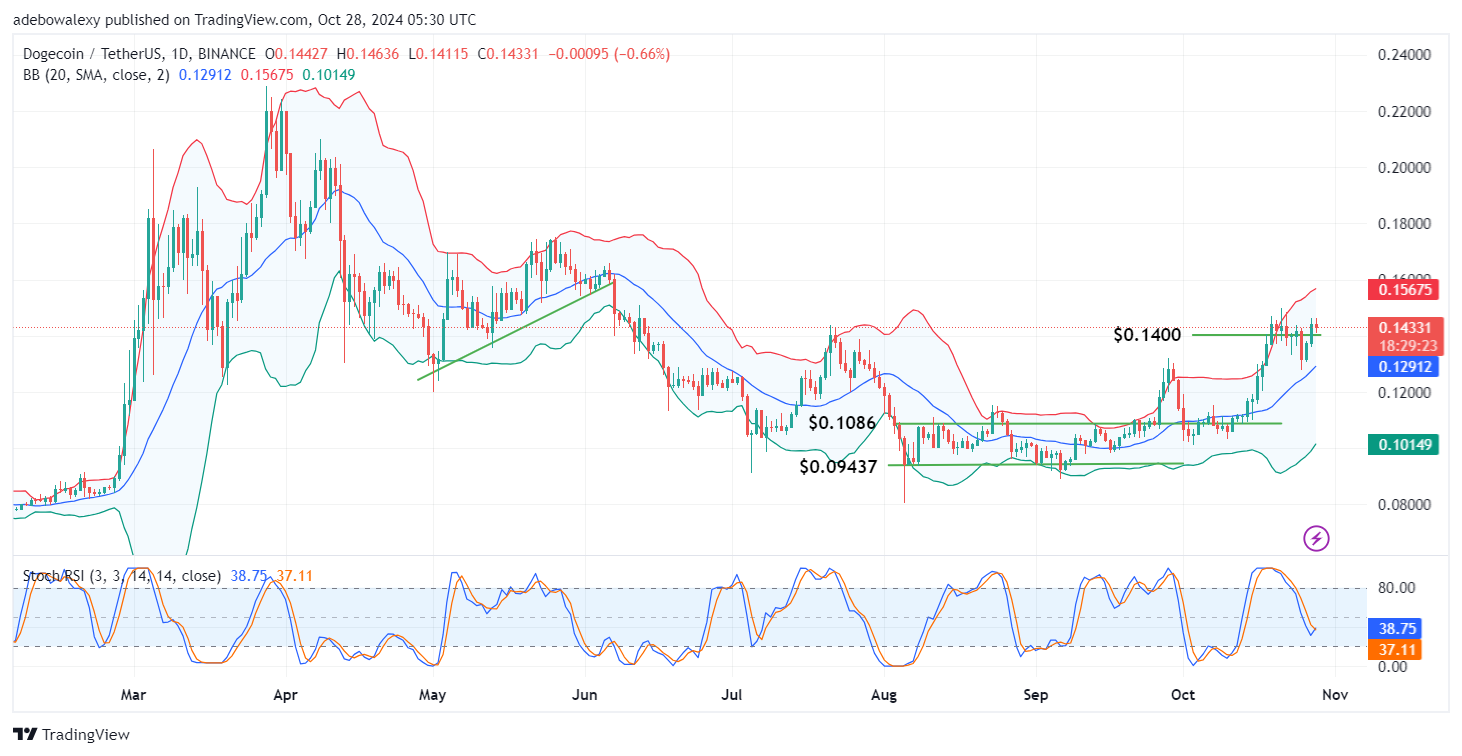
In the Dogecoin daily market, price action is above the middle limit of the Bollinger Bands. However, the current session has turned bearish, standing just above the $0.1400 threshold. The Bollinger Bands indicator is now tilted upward, signaling the overall short-term trend in this market. Simultaneously, the Stochastic Relative Strength Index (Stochastic RSI) is at an upward crossover around the 40 mark of the indicator.
Dogecoin Price Prediction: Will DOGE/USDT Continue Above the $0.1400 Threshold?
While price activity in the Dogecoin daily market has surfaced again above the $0.1400 threshold, the current session raises questions about continuity. As can be seen, the price candle corresponding to the current session has appeared bearish. However, it has only resulted in a minimal price decline, and as such, the coin continues to trade above the $0.1400 threshold.
Additionally, the session is taking place at a considerable distance above the Bollinger Bands’ middle limit, while the indicator itself is trending upward. Furthermore, the Stochastic RSI lines are at a crossover, suggesting that price movement may gain more traction as trading continues.
Dogecoin Price Prediction: DOGE/USDT Still Appears Challenged (4-Hour Chart)
Even in the Dogecoin 4-hour market, price activity remains above the middle limit of the Bollinger Bands indicator. Price action has also pushed against the uppermost limit of the indicator, and the market has reacted with a minimal downward rejection. The Stochastic RSI lines remain above the 80 mark but show a slight downward trajectory.
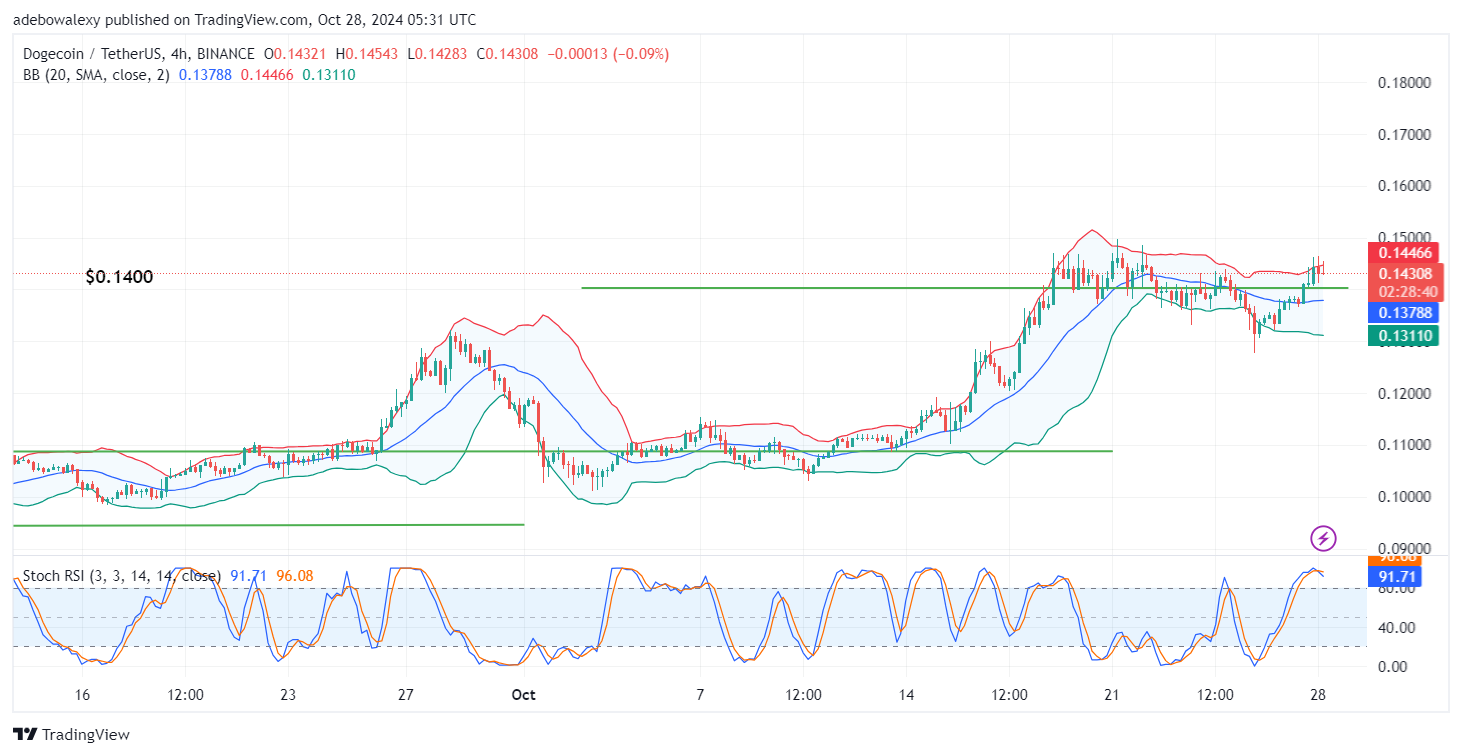
Technically, price action in this market still appears elevated. Nevertheless, downward forces have had some influence in recent sessions. Be that as it may, the last price candle on the chart suggests that upward forces are already providing resistance to further downward corrections. This suggests that traders might want to hold their bullish positions as long as price action remains above the $0.1400 threshold, as the market may continue toward the $0.1500 mark.