Wall Street Memes (WSM/USD) Trade Sways, Stimulating Stances
Estimated Reading Time: 4 minutes
Don’t invest unless you’re prepared to lose all the money you invest. This is a high-risk investment and you are unlikely to be protected if something goes wrong. Take 2 minutes to learn more

Wall Street Memes Price Prediction – July 24
The changes in the market for Wall Street Memes coin compared to the US dollar are becoming more active, as the coin’s value moves up and down, stimulating proceeds through changing trends, investor interest, and occasional buying and selling.
In recent trading sessions, the behavior of the lower Bollinger Band trend line has increasingly signaled positive structural support, especially around the $0.0007 level. This supportive alignment has helped anchor the WSM/USD market, paving the way for a potential bullish breakout as buying interest gradually builds. The setup now leans favorably toward an upswing, with rebound momentum gaining traction and the likelihood of sustained price appreciation strengthening.
WSM/USD Market
Key Levels
Resistance levels: $0.0008, $0.0009, $0.001
Support levels: $0.0006, $0.0005, $0.0004
WSM/USD – 4-Hour Chart
It is displayed on the WSM/USD 4-hour chart that the crypto-economic trade presently sways about, stimulating proceeds in the indexes.
The Bollinger Bands have tentatively positioned in an eastward-positioning posture, portending that the market’s actions are being characterized by smaller candlesticks featuring in tight trading ranges around $0.0007. Meanwhile, the stochastic oscillators are in the motion of gently swinging southbound closely to the point of 20, reflecting mild selling pressure without deeper downward conviction.
Given the Subdued Momentum Near $0.0007, Could WSM/USD Extend Its Consolidation Phase Further?
Given the subdued momentum near $0.0007, WSM/USD may briefly extend its consolidation; however, long-term investors are urged not to lose recouping energy, as the current structural base points toward a developing bullish foundation. Sustained accumulation at this level could ignite the next upward leg, as the crypto market sways, stimulating proceeds.
While the paired instrument has shown a relatively consistent push to the upside, indicating an effort to resume its broader northward trajectory, caution is still warranted. Partakers are strongly advised to utilize the oscillators in identifying optimal entry points for long positions—especially when supported by convergence signals and favorable broader market sentiment—to avoid missteps during potential false breakouts or premature rallies that may precede steady declines.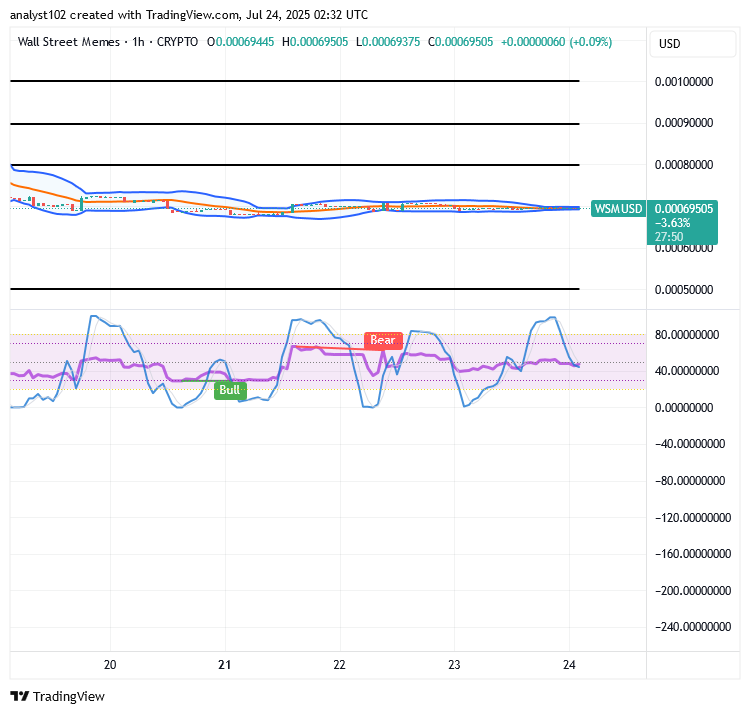
WSM/USD 1-Hour Chart
The WSM/USD market’s 1-hour chart reveals that the crypto-economic business sways in its motion, stimulating proceeds.
The Bollinger Bands are presently maintaining an eastward-driven motion, encapsulating the trading candlesticks around the $0.0007 mark, subtly hinting at a forthcoming directional shift. Meanwhile, the stochastic oscillators hover near the 40 level, gradually attempting to reposition in preparation for a potential upward turn, suggesting an early buildup of bullish momentum.
$WSM / $USDT is now officially tradeable on #Bybit Perpetuals with enhanced market liquidity access.
$WSM community, we saw your Tweets! 👏$WSM / $USDT is now tradeable on #Bybit Perpetuals.
— Bybit (@Bybit_Official) October 13, 2023
Trade here: https://t.co/le4XyVyXaZ
Also want your project listed? Share your suggestions here:https://t.co/W7EWJVVNV5 https://t.co/XgXoL7g0rF