Wall Street Memes (WSM/USD) Price Flutters, Rejuvenating Moves
Estimated Reading Time: 3 minutes
Don’t invest unless you’re prepared to lose all the money you invest. This is a high-risk investment and you are unlikely to be protected if something goes wrong. Take 2 minutes to learn more

Wall Street Memes Price Prediction – July 23
Movements in the market operations that showcase the pairing outlook of Wall Street Memes coin with the valuation of the US dollar are being that the base instrument currently flutters around, rejuvenating moves in its input.
Over the past few trading sessions, the positioning behavior of the lower Bollinger Band trend line has played a pivotal role in stabilizing downside pressures, subtly supporting the WSM/USD market’s structure. This has provided a soft landing zone for price actions, setting the stage for the long-anticipated rebound momentum to potentially unfold with increasing velocity.
WSM/USD Market
Key Levels
Resistance levels: $0.0008, $0.0009, $0.001
Support levels: $0.0006, $0.0005, $0.0004
WSM/USD – 4-Hour Chart
It is depicted on the WSM/USD 4-hour chart that the crypto market currently flutters, rejuvenating moves at the close top area of the buy signal side of the lower Bollinger Band.
The stochastic oscillators are currently forming a repositioning pattern with a mild descent toward the southern region, yet still maintaining a structure aligned with a bullish threshold outlook. Meanwhile, the Bollinger Bands are tightly compressed in an eastward formation, reflecting ongoing consolidation and suggesting that the market is preparing for a decisive breakout as volatility builds beneath the surface.
Is Initiating a Short-Term Bearish Position on WSM/USD Around the $0.0007 Level Technically Justified Now?
There has been a growing indication in the WSM/USD trade that rebounding efforts are frequently underway, even within a sideways market outlook, as the price currently flutters around the $0.0007 level, signaling renewed bullish undertones in its structure.
The paired instrument has been showing a relatively consistent push to the upside, suggesting an attempt to resume its broader northward trajectory. In the meantime, it is strongly recommended that partakers should find the oscillators instrumental in determining the ideal time to launch long orders, particularly when combined with convergence signals and broader market sentiment prompts.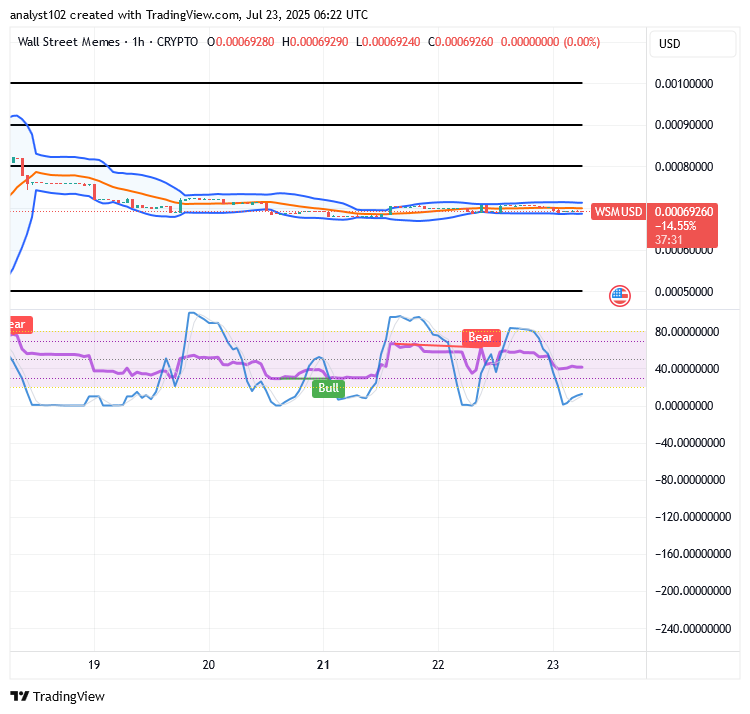
WSM/USD 1-Hour Chart
The WSM/USD market’s 1-hour chart reveals that the crypto-economic trade flutters, rejuvenating moves.
The stochastic oscillators have turned southbound, swinging in the oversold region, reinforcing the potential exhaustion of bearish momentum. The Bollinger Bands are presently maintaining an eastward-driven motion, embodying the trading candlesticks around the $0.0007 mark, hinting at a forthcoming directional shift.
Explore unprecedented trading opportunities with dynamic 1–25x leverage functionality—now seamlessly integrated into the Bybit Futures Grid Bot for enhanced algorithmic precision. Begin your trading journey today!
📈 BIGTIME: https://i.bybit.com/20rabgrK
📈 WSM: https://i.bybit.com/ab1F9gWH
🚀 BIGTIMEUSDT & WSMUSDT Contracts now on Bybit!
— Bybit (@Bybit_Official) October 12, 2023
Dive into new trading opportunities with 1-25x leverage. Plus, they’re now on Bybit Futures Grid Bot! Start trading now.
📈 BIGTIME: https://t.co/FAQlbhnzAh
📈 WSM: https://t.co/pb2y2AfMBE#CryptoTrading #Bybit