Wall Street Memes (WSM/USD) Price Bounces, Stirs Bull Run
Estimated Reading Time: 3 minutes
Don’t invest unless you’re prepared to lose all the money you invest. This is a high-risk investment and you are unlikely to be protected if something goes wrong. Take 2 minutes to learn more
Wall Street Memes Price Prediction – July 22
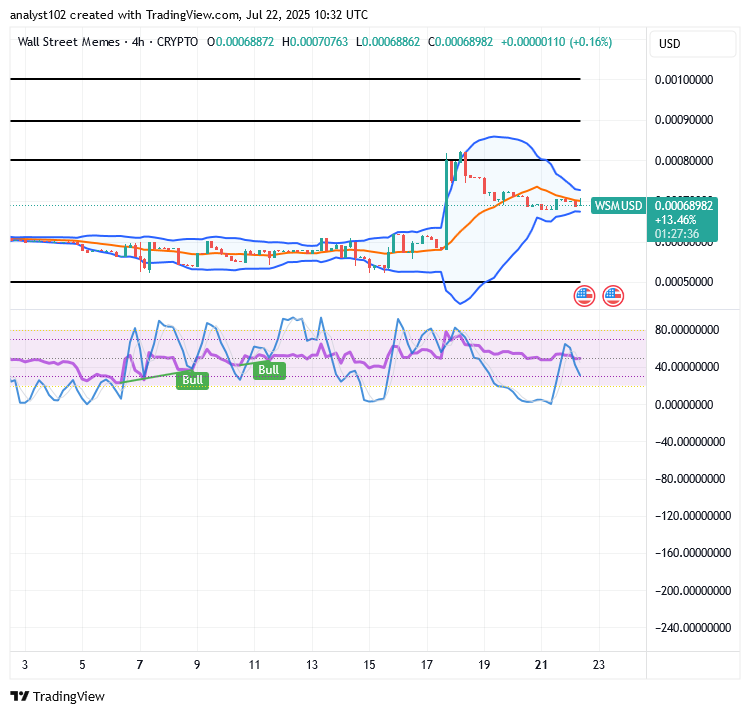
Variant candlesticks have appeared with differing bottoming outlooks, showcasing a loss of strong momentum against the lower Bollinger Band line further to the downside, as the WSM/USD market bounces around, stirring a bull run in the formation setup.
To broadly emphasize the movements of the Wall Street Memes coin market against the valuation of the US dollar around the territories defined by the Bollinger Bands indicators, it is now evident that buying and selling forces are being confined between the middle and lower Bollinger Bands trend lines, allowing traders to prepare for entry positions that are most likely to favor long decisions in the long run.
WSM/USD Market
Key Levels
Resistance levels: $0.0008, $0.0009, $0.001
Support levels: $0.0006, $0.0005, $0.0004
WSM/USD – 4-Hour Chart
It is established on the WSM/USD 4-hour chart that the crypto-economic price is bouncing around the $0.0007 trade point, stirring bullish run indicators.
The technical formation of the Bollinger Bands indicates that the market is maintaining a systemic and gradually maturing pattern, highlighting strategic zones where long-term investors should focus before capitalizing on potential bullish spikes. The stochastic oscillators are now swerving northward, clearly signaling that additional buying strength and momentum are being injected into the market by WSM trade bulls.
Will the Steady Bottoming of the WSM/USD Market Price at the Lower Bollinger Band Trigger a Breakdown?
The steady bottoming of the WSM/USD price at the lower Bollinger Band may suggest accumulation, potentially preceding a strong bullish reversal rather than a breakdown, given that the price bounces around $0.0007, stirring a bull run.
Amid prevailing crypto market conditions, WSM/USD exhibits substantial undervaluation, establishing itself as a compelling asset for strategic long-term accumulation and portfolio positioning. Its technical structure and early-stage growth potential suggest strong upside ahead, attracting forward-looking investors anticipating a robust rebound and sustained value appreciation.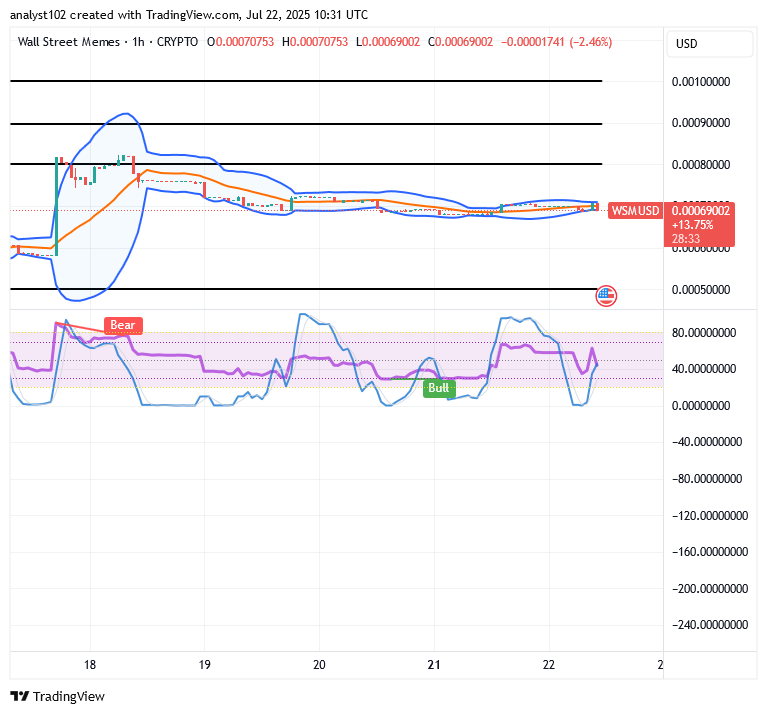
WSM/USD 1-Hour Chart
The WSM/USD market’s 1-hour chart showcases that the crypto-economic business activity bounces in a rising-driven flag shape, stirring a bull run.
The Bollinger Bands have been tactically stretching over an extended period, structurally revealing ideal zones for potential bullish recoupment amid reduced volatility compression. The stochastic oscillators, at the time of writing, are sustaining a bullish signal, swerving upward with growing momentum strength and convergence cues.
Engage in leveraged trading with the newly listed $WSM perpetual pair on Bybit’s derivatives platform.
📈 Start trading: https://i.bybit.com/1Wab4K3z
Have a token you’d like to see listed? Submit your listing request here:
🔗 http://i.bybit.com/1Fd2aboX
$WSM community, we saw your Tweets! 👏$WSM / $USDT is now tradeable on #Bybit Perpetuals.
— Bybit (@Bybit_Official) October 13, 2023
Trade here: https://t.co/le4XyVyXaZ
Also want your project listed? Share your suggestions here:https://t.co/W7EWJVVNV5 https://t.co/XgXoL7g0rF