Kyber Network (KNC/USD) Breaks Through the $0.800 Resistance Level
Estimated Reading Time: 2 minutes
Don’t invest unless you’re prepared to lose all the money you invest. This is a high-risk investment and you are unlikely to be protected if something goes wrong. Take 2 minutes to learn more
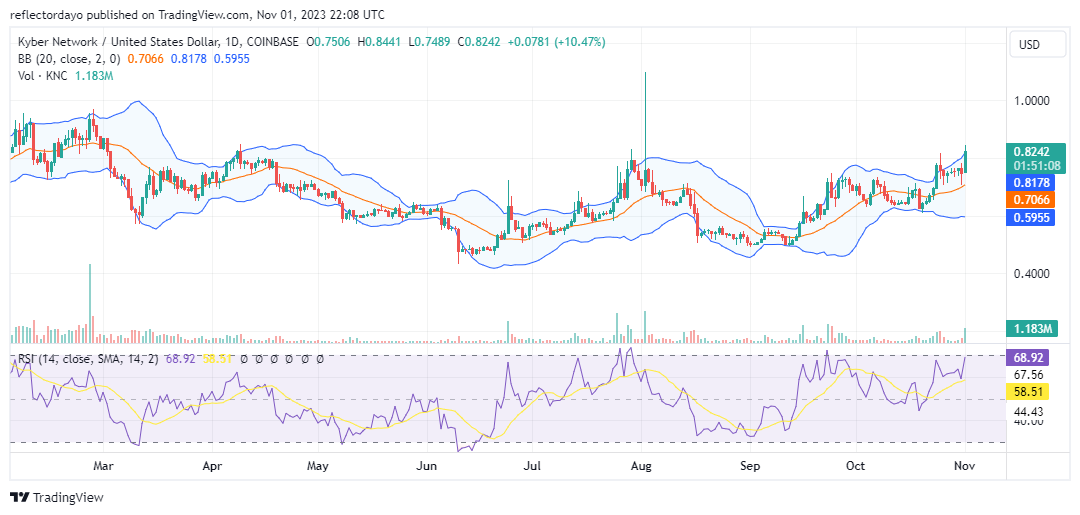
The month of November holds promise for the Kyber Network market. Today, on the first day of the month, the bull market has breached the $0.800 price level. Bearish sentiment had kept the market below this level for an extended period. The $0.800 price level has served as a persistent resistance point since March. Breaking this resistance level could potentially stimulate significant bullish sentiment among traders.
Kyber Network Market Data
- KNC/USD Price Now: $08277
- KNC/USD Market Cap: $140,755,150
- KNC/USD Circulating Supply: 170,575,431
- KNC/USD Total Supply: 170,575,754 KNC
- KNC/USD CoinMarketCap Ranking: #179
Key Levels
- Resistance: $0.850, $0.900, and $0.950.
- Support: $0.580, $0.530, and $0.500.
Kyber Network Price Forecast: Analyzing the Indicators
The current Kyber Network bull market has originated at the $0.74 support level, which is in close proximity to the critical $0.800 price level. The bulls managed to drive the market to the $0.845 price level before encountering a retracement. A closer examination of the trade volume histogram suggests that the bullish momentum is well-supported, increasing the likelihood of the bulls converting the $0.800 resistance level into a strong support level. The Bollinger Bands indicator, with its upper standard deviation, indicates market strength. However, the lower standard deviation remains relatively stable, potentially allowing the bulls to maintain the market above the $0.800 level.
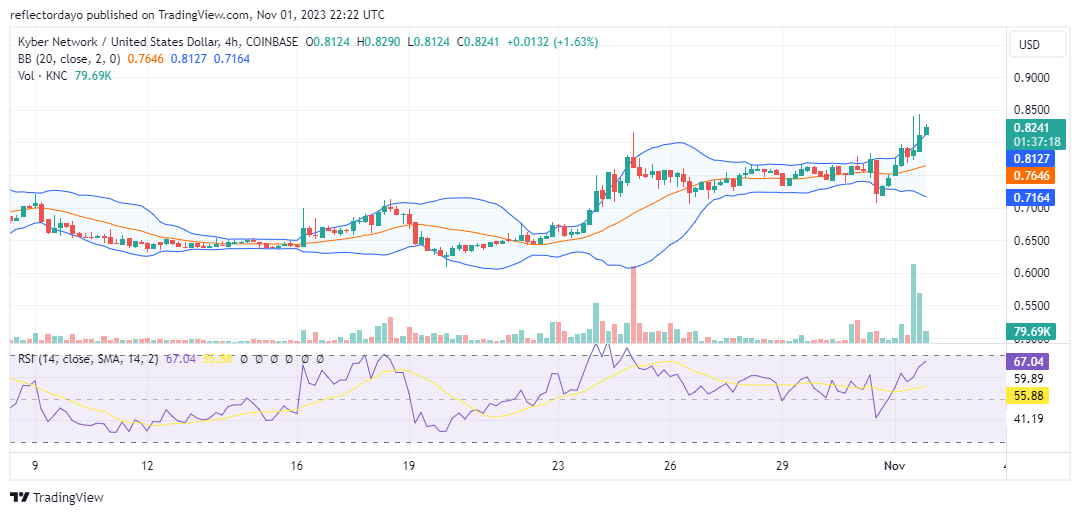
KNC/USD 4-Hour Chart Outlook
In a shorter-term market analysis, we observe the emergence of a bearish trend as the bulls push the price into the $0.800 price zone. It is notable that the bears appear to be originating from the $0.850 price level, causing the lower band of the Bollinger Bands indicator to react, indicating an increasing bearish momentum. Notably, the trade volume has exhibited a decline, evident in the shorter histogram. This decrease in trade volume may pave the way for the establishment of a support level at the $0.800 price, potentially sustaining the upward momentum of the bull market.