Polygon (MATIC/USD) Trade Is Recuperating from a Correction
Estimated Reading Time: 3 minutes
Don’t invest unless you’re prepared to lose all the money you invest. This is a high-risk investment and you are unlikely to be protected if something goes wrong. Take 2 minutes to learn more
Polygon Price Prediction – March 26
The aftermath pit trading moment around the $1.30 has led to a session showcasing that the MATIC/USD trade is recuperating from a correction. As of the writing of this technical sentiment, the crypto-economic market percentage rate is at 2.22 positives, trading between $1.109 and $1.074. As bulls seem to be on a longing route, the entire trading force has been moving slowly.
MATIC/USD Market
Key Levels
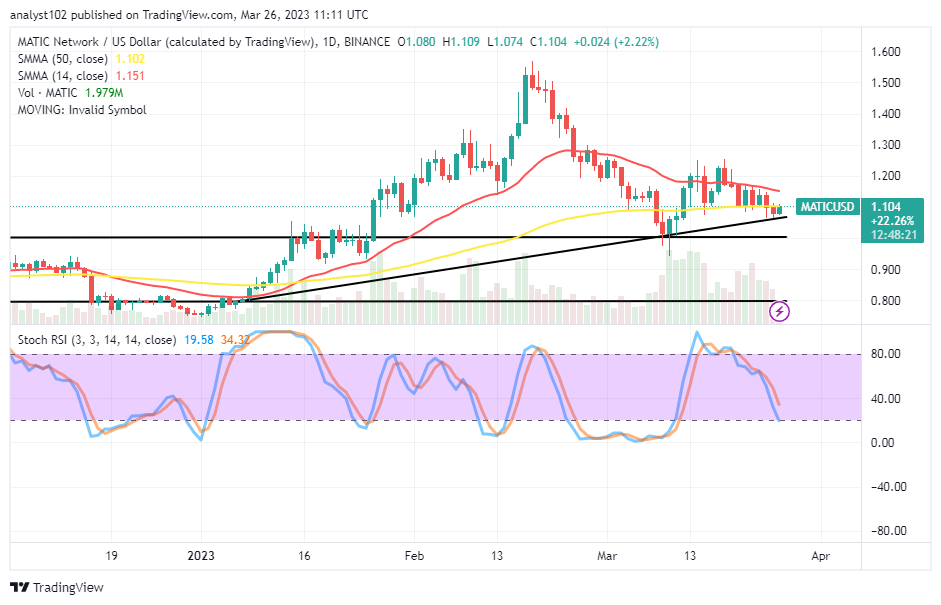
Resistance levels: $1.20, $1.30, $1.40
Support levels: $1, $0.90, $0.80
MATIC/USD – Daily Chart
Today’s MATIC/USD daily chart depicts the crypto-economic trade recuperating from a correction above the upper range line drawn underneath the trend lines of the SMAs. The bullish trend line draws through the line to mark up the significant point where the price can swing. The 14-day SMA indicator is at $1.151 over the $1.102 value line of the 50-day SMA indicator. The Stochastic Oscillators have veered away from the overbought area and reached 34.32 and 19.58 levels.
What is the candlestick’s current observable sign for the MATIC/USD market operations?
The present observative sign from the MATIC/USD market trading candlestick signifies a start of regaining the catalyst as the price has been recuperating from a correction chain. The price needs to stay above the upper range line set at the $1 support for the recovery motion to continue in the long run. Buyers planning to follow the current trend should put their stop loss pending order close to the previously indicated support level.
On the downside of the technical analysis of the MATIC/USD market, at this moment, sellers are to be cautious of executing fresh shorting position orders. A trait of a systemical trading approach may implore being on the lookout for active rejection of the price-around resistance points outlined above before launching a sell order. If the market moves slowly in a rallying state while showcasing through the SMA trend lines, bears may decide to remain away from the trades.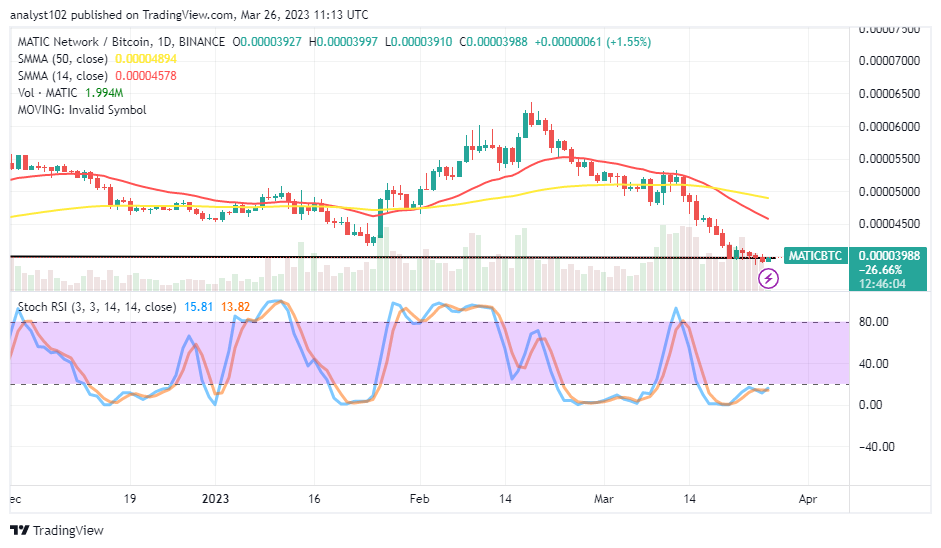
MATIC/BTC Price Analysis
In contrast, Polygon’s trending weight has somewhat debased to a lower-trading zone that could soon witness a rebound against the purchasing worth of Bitcoin. The 14-day SMA indicator is bending southward underneath the 50-day SMA indicator. And they are over the formation of trading candlesticks. The Stochastic Oscillators are in the oversold region, consolidating to affirm that a falling force may not have ended. However, bears should be getting ready to pull out the moment a bullish candlestick emerges in an attempt to push past the smaller trend line.
Note: Cryptosignals.org is not a financial advisor. Do your research before investing your funds in any financial asset or presented product or event. We are not responsible for your investing results.
You can purchase Lucky Block here. Buy LBLOCK