Polygon (MATIC/USD) Price Sets for a Pit Stop, Averaging $1.30
Estimated Reading Time: 3 minutes
Don’t invest unless you’re prepared to lose all the money you invest. This is a high-risk investment and you are unlikely to be protected if something goes wrong. Take 2 minutes to learn more
Polygon Price Prediction – March 19
The Polygon market currently sets for a pit stop against the US currency as it averages the $1.30 line. Since the start of today’s trading activities, buyers have repeatedly attempted to push between the zones of the $1.207 and $1.173 value lines at a maximum percentage rate of 1.02 positive. Even if there is a loss of strength in the sellers’ pushing power at this time, the market’s upward impulse will likely falter.
MATIC/USD Market
Key Levels
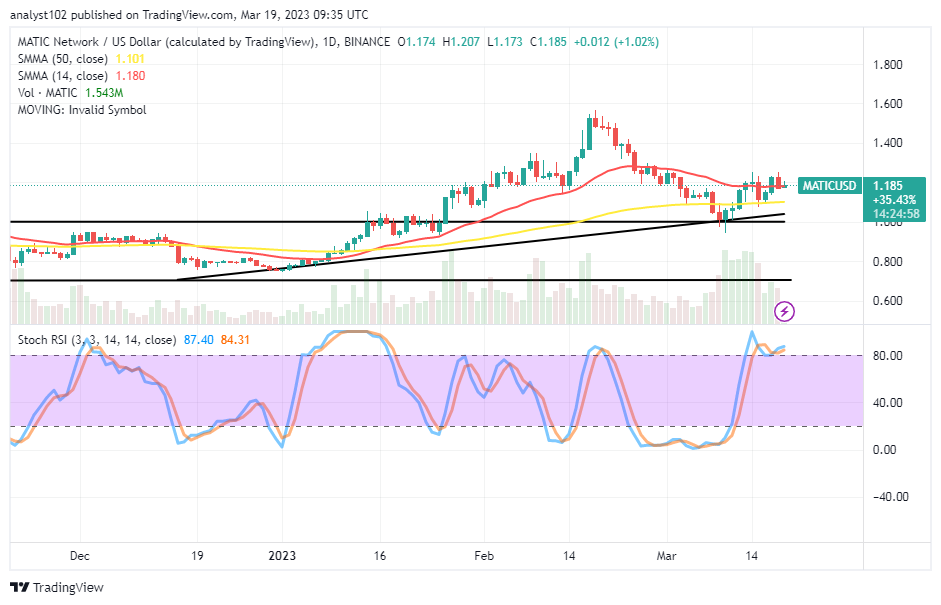
Resistance levels: $1.30, $1.40, $1.50
Support levels: $1, $0.90, $0.80
MATIC/USD – Daily Chart
The MATIC/USD daily chart reveals that the crypto-economic price sets for a pit stop, averaging the $1.30 level. The 14-day SMA trend line is at $1.180, closely above the 50-day SMA trend line, which is at $1.101. The Stochastic Oscillators are around the 87.40 and 84.31 levels. The positioning of the Stochastics portends that much of the strong motion has almost exhausted, signaling a warning against pursuing any presumed attempt to move northward more outside its present high point of around $1.207.
Will the MATIC/USD market operation continue with a pit-stop trading scenario?
Within the confinement of the trading psyche, the MATIC/USD market tends to prolong its presence around the trend lines of the SMAs as the price sets for a pit stop, averaging the $1.30 resistance level. Further efforts to push to the north side could abysmally lead to a reversal in no time. Therefore, it would even be technically better to let out on the thought of trying to execute a buying order as the price hovers around the 14-day SMA indicator presently.
On the downside of the technical analysis of the MATIC/USD market, short-position placers need to be watchful of active reversal-l-moving mode that can surface against the trend line of the smaller SMA after a long-holding of range motions, especially when the Stochastic Oscillators maintain a tangible cross to the southbound from around the overbought region afterward. The critical resistance level is said to be around $1.40.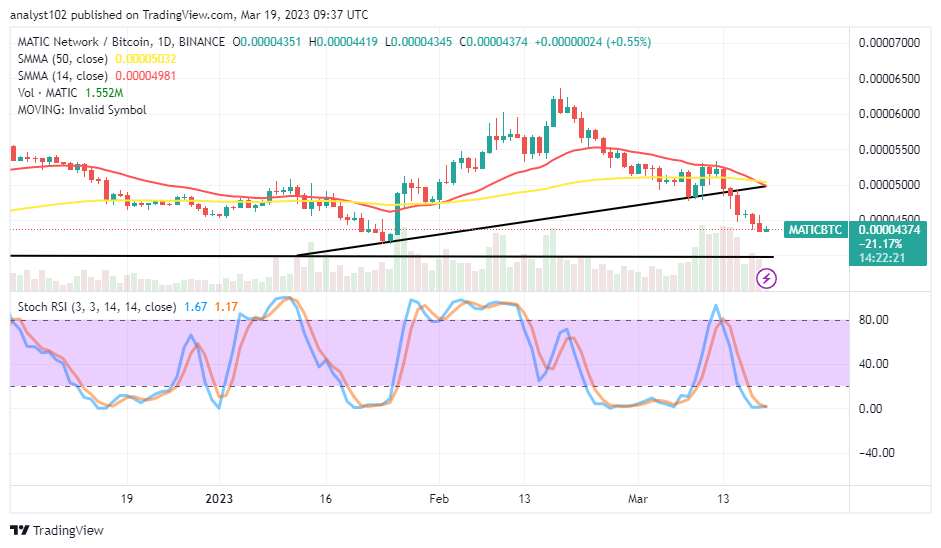
MATIC/BTC Price Analysis
In contrast, Polygon has been dipping against the trending force of Bitcoin to a large extent of dragging an interception of the bigger SMA by the smaller SMA to the downside possible for confirmation of seeing the former crypto lying flat in a consolidation mode against its latter instrument. The 14-day SMA indicator has bent southward, attempting to cross the 50-day SMA indicator. The Stochastic Oscillators are in the oversold region, keeping 1.17 and 1.67 levels. Despite a smaller bullish candlestick in the making, bulls still need to show prudence before considering a lengthy position order.
Note: Cryptosignals.org is not a financial advisor. Do your research before investing your funds in any financial asset or presented product or event. We are not responsible for your investing results.
You can purchase Lucky Block here. Buy LBLOCK