Ethereum (ETH) Battles the Resistance at $2,480, Eyes a Target Price above $2,600
Estimated Reading Time: 2 minutes
Don’t invest unless you’re prepared to lose all the money you invest. This is a high-risk investment and you are unlikely to be protected if something goes wrong. Take 2 minutes to learn more

Ethereum Price Long-Term Analysis: Bullish
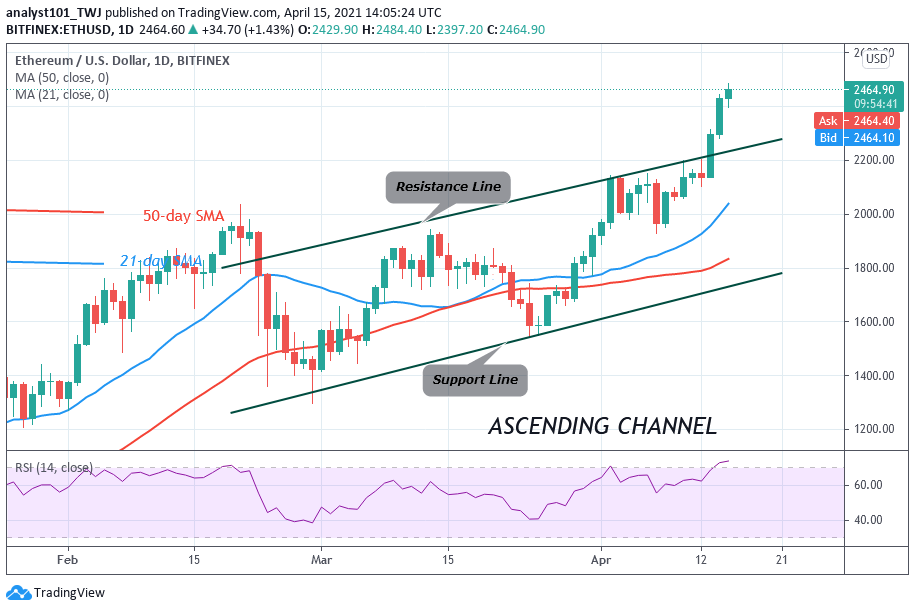
Ethereum bulls are struggling to break above the $2,480 resistance. At each retest at the resistance, the market will fall to the $2,400 support. The bottom line is that if buyers break the current resistance, Ether will rise to rally above the high of $2,600. Today, buyers have made three attempts at the resistance zone.
Ethereum Indicator Analysis
Ether price will continue on the upside as price breaks and closes above the resistance line of the ascending channel. The biggest altcoin is at level 73 of the Relative Strength Index period 14. The RSI has indicated that ETH price has reached the overbought region of the market. Sellers may emerge to push prices down. The 21-day and 50-day SMA are sloping upward indicating the uptrend.
Technical indicators:
Major Resistance Levels – $2, 600, $2,800, $3,000
Major Support Levels – $1.500, $1, 300, $1,100
What Is the Next Direction for Ethereum?
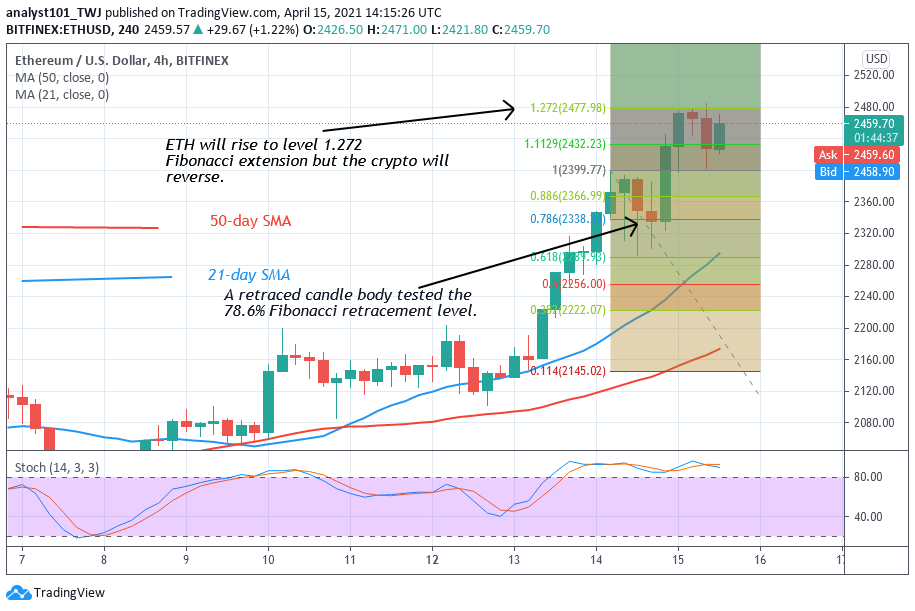
On 4- hour chart, the price has indicated an upward movement of price. On April 14 uptrend; a retraced candle body tested the 78.6% Fibonacci retracement level. The retracement indicates that the market will rise and reverse at level 1.272 Fibonacci extension or the high of $2,480.06. Today, the price action has reached the Fibonacci level and reversed. Buyers are retesting the resistance level to break above it.
Note: cryptosignals.org is not a financial advisor. Do your research before investing your funds in any financial asset or presented product or event. We are not responsible for your investing results