Polygon (MATIC/USD) Market Swings Northward From $1
Estimated Reading Time: 3 minutes
Don’t invest unless you’re prepared to lose all the money you invest. This is a high-risk investment and you are unlikely to be protected if something goes wrong. Take 2 minutes to learn more
Polygon Price Prediction – March 12
About four days back, a significant decline occurred in the MATIC/USD trade operations to cause a panic sell-off moment after the price broke downside against the $1 line. But the crypto market swings northward from the value line to bargain between the trading zones of $1.079 and $1.058 at a minute percentage rate of 0.28 positive. It has re-occurred that buying position orders have to feature firmly against any unprecedented sharp drop that can surface in no time.
MATIC/USD Market
Key Levels
Resistance levels: $1.20, $1.30, $1.40
Support levels: $0.95, $0.85, $0.75
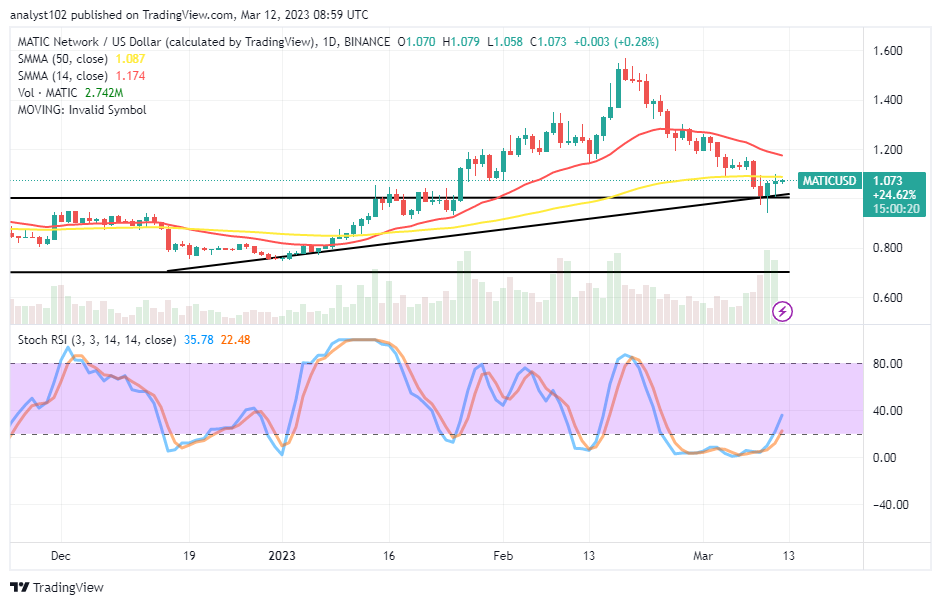
MATIC/USD – Daily Chart
The MATIC/USD daily chart showcases that the crypto-economic market swings northward from the $1 level. The 14-day SMA trend line has curved southward from the top at $1.174 toward the 50-day SMA trend line underneath the $1.087 value line. The Stochastic Oscillators have crossed northbound from the oversold region to maintain 22.48 and 35.78 levels. A barrier line has been around the bigger SMA indicator against the formation of variant bullish candlesticks as of the compiling of this technical piece.
Will the MATIC/USD exchange continue to rise above $1?
The formation of two variant trading candlesticks, showcasing bottom shadows against the $1 between the 9th and 10th of this month’s session, signifies some ups may stay for some time as the MATIC /USD market swings northward from the value line. Based on the current upward swinging capacity, long-position placers need to be strategic in their longing order system by protecting their presence around or a bit beneath the point of the upper range zone. If the Stochastics swerve to the point of 80, an attempt of the blue line to cross back the red to the southbound will mean an end to the upside surges.
On the downside of the technical analysis of the MATIC/USD market, sellers are to be on the lookout for a reversal of an active northward push beneath or around the $1.20 resistance before executing a shorting order afterward. Bears should wait to make a comeback in the event of erratic motions to the north side against the point until the presumable pressures have subsided. An overbought reading condition of the Stochastic Oscillators will be highly technically instrumental in the shorting order positions.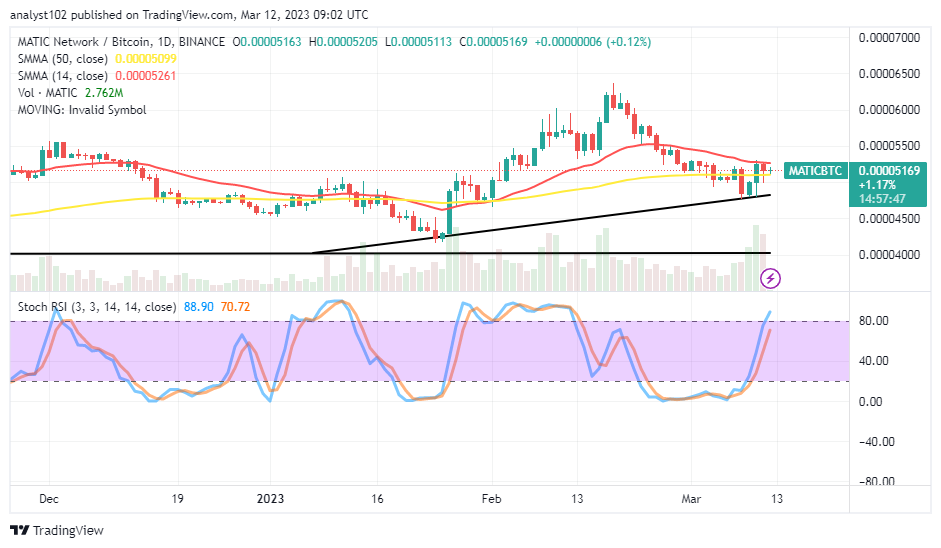
MATIC/BTC Price Analysis
In contrast, Polygon’s trending outlook pace has almost reached a psychological peak, pairing with Bitcoin. In other words, the crypto-economic market pair swings northward from a lower-trading zone against the SMA trend lines. The 14-day SMA indicator is above the 50-day SMA indicator. The Stochastic Oscillators have traveled northbound from the oversold region to 70.72 and 88.90 levels. The base crypto economy appears to lose momentum soon as it had a smaller bearish trading candlestick to denote a warning against having sustainable ups further at this point.
Note: Cryptosignals.org is not a financial advisor. Do your research before investing your funds in any financial asset or presented product or event. We are not responsible for your investing results.
You can purchase Lucky Block here. Buy LBLOCK