Polygon (MATIC/USD) Price Elongates Basement Toward $1
Estimated Reading Time: 3 minutes
Don’t invest unless you’re prepared to lose all the money you invest. This is a high-risk investment and you are unlikely to be protected if something goes wrong. Take 2 minutes to learn more
Polygon Price Prediction – March 5
Against the expectation to have seen the MATIC/USD market find energy-building manner around $1.20 in the recent operation, the crypto economy elongates basement toward $1.According to current data, there have been some positive developments within the trading ranges of the pairing instrument between the high and low values of $1.160 and $1.118, maintaining a generally positive average percentage rate of 1.33. The trading trait suggests price is in the process of striving to make a swing high.
MATIC/USD Market
Key Levels
Resistance levels: $1.35, $1.40,
Support levels: $1, $0.95, $0.90
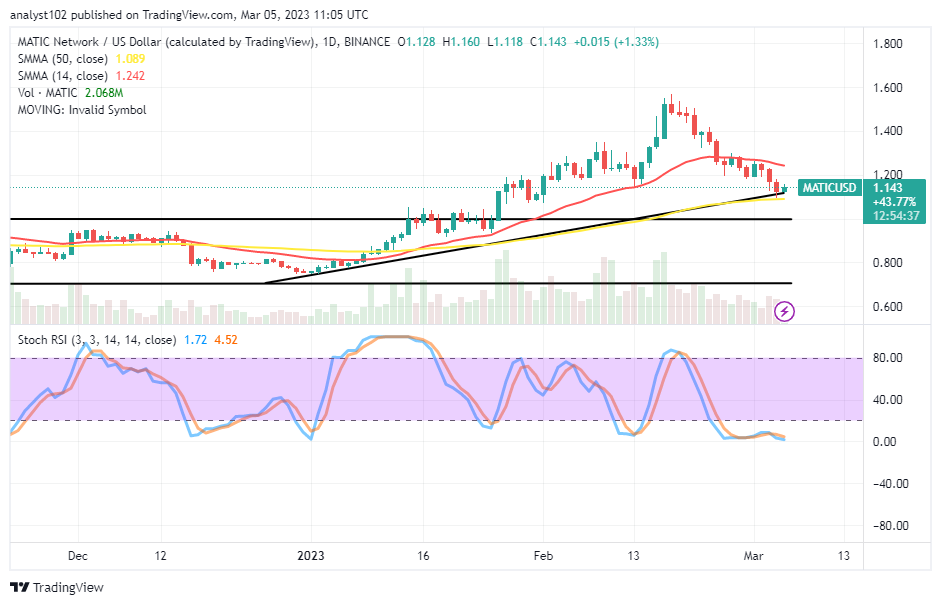
MATIC/USD – Daily Chart
It is revealed on the MATIC/USD daily chart that the crypto-economic price elongates the basement toward the $1 support level after failing to hold back their positions upright from the $1.20 psychological point. The 50-day SMA trend line’s value line of $1.089 is above the 14-day SMA trend line at $1.242, which is currently slightly curved southward. The Stochastic Oscillators are moving in a consolidation pattern between the 1.72 and 4.52 levels and are oversold. That suggests that the reductionist movements have been drawing to a close.
Will the MATIC/USD trade slide past $1 shortly?
Sliding lower beyond the $1 support level may not be forthcoming in the near time, even though it has been that the MATIC/USD price elongates the basement toward the point line. In the meantime, the Stochastic Oscillators are signifying that buyers may soon be garnering the momentum to make a stride if the market line resists further drops around the bigger SMA trend line’s value. A resumption of a sustainable hike to breach the smaller value at $1.242 will amount to letting in some increases in the following activities.
On the downside of the technical analysis of the MATIC/USD market, bears will now have to establish a firm stance against the US economy below the point of the 14-day SMA indicator. A retest of the market around that point will decimate the forces to upsurge afterward. The market trading positions have moved in retracement over a few days. However, caution has to adhere strictly.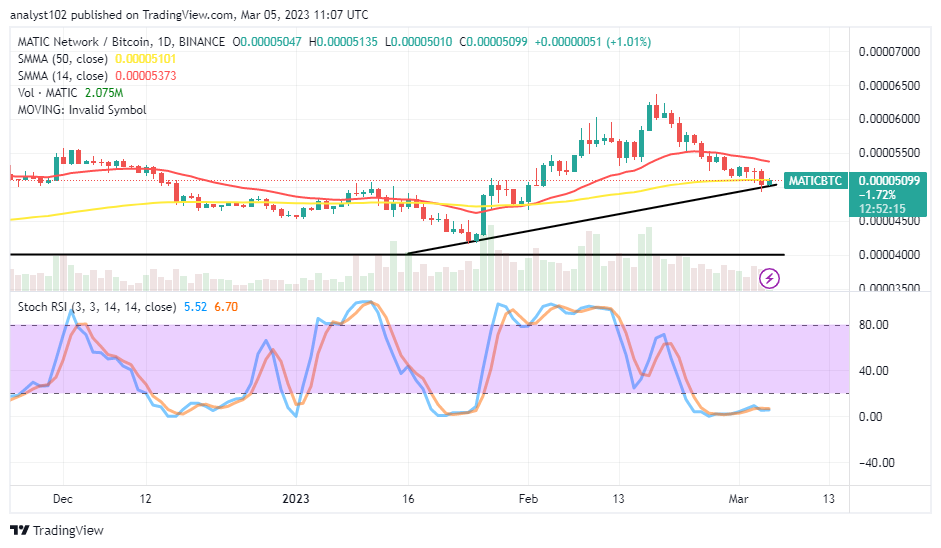
MATIC/BTC Price Analysis
In contrast, Polygon has continued to hold positions in dip against the trending ability of Bitcoin. In other words, the crypto pair price elongates the basement toward a lower value line beneath the bigger SMA indicator. The Stochastic Oscillators are in the oversold region at 6.70 and 5.52 levels to signify the base crypto instrument is still under a relative selling force. Short-position placers shouldn’t open new shorting orders at this moment. Instead, buyers could watch out for the emergence of a bullish-trading candlestick to ride on as quickly as possible.
Note: Cryptosignals.org is not a financial advisor. Do your research before investing your funds in any financial asset or presented product or event. We are not responsible for your investing results.
You can purchase Lucky Block here. Buy LBLOCK