Polygon (MATIC/USD) Trade Attempts to Build up Catalyst at $1.20
Estimated Reading Time: 3 minutes
Don’t invest unless you’re prepared to lose all the money you invest. This is a high-risk investment and you are unlikely to be protected if something goes wrong. Take 2 minutes to learn more
Polygon Price Prediction – February 26
The recent fall-off showcasing a line of corrections in the MATIC/USD market operations has somewhat had its path to an exhaustion lower-trading spot, warranting the need for the crypto trade to attempt to build up a catalyst around the $1.20 line. Positive signs are on a gradual moving force, erupting at an average percent of 1.92, embodying the reactions of buying and selling activities between the $1.284 and $1.238 value lines.
MATIC/USD Market
Key Levels
Resistance levels: $1.40, $1.50, $1.60
Support levels: $1.05, $0.95, $0.85
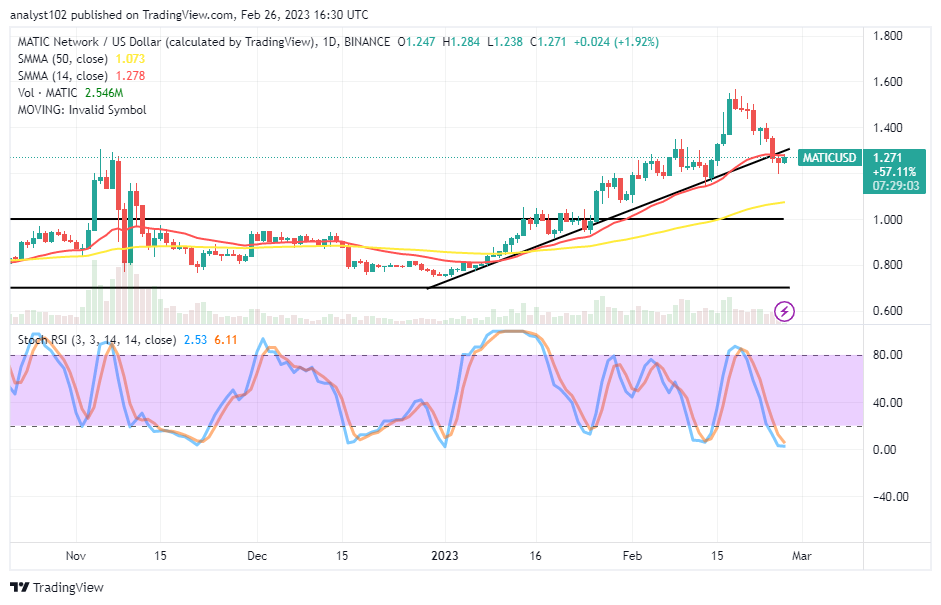
MATIC/USD – Daily Chart
It mirrors on the MATIC/USD daily chart that the crypto-economic trade attempts to build up a catalyst around $1.20.After making contact with the value line, a bearish candlestick formed a bottom shadow. The 14-day SMA trend line is at $1.278 over the $1.073 value point of the 50-day SMA trend line. The bullish trend line remains drawn northward, touching the lower points price has been making high swings so far. The Stochastic Oscillators have dipped into the oversold region, maintaining 6.11 and 2.53 levels.
Is the MATIC/USD market still at risk of a valuation downgrade of around $1.20?
There have been less-active forces to consolidate in favor of bears to push past the $1.20 psychological beneath the 14-day SMA’s point as the MATIC/USD trade attempts to build up a catalyst around the value line. Around that point, buyers may need to wait for a while to see when the Stochastic Oscillator will be to cross northward from the zone of the oversold region. For that assumption to come past, upward pressures must remain above $1.278.
On the downside of the technical analysis of the MATIC/USD market sellers will need to allow a formation to surface around the $1.60 previous high resistance level. On the other side, the presence of the Stochastic Oscillators, suggesting an overbought reading condition, will potentially signify the potentiality of seeing a resumption of a declining trend in no time. In the wake of that assumption playing out, shorting orders may execute in a pending style among those resistance levels.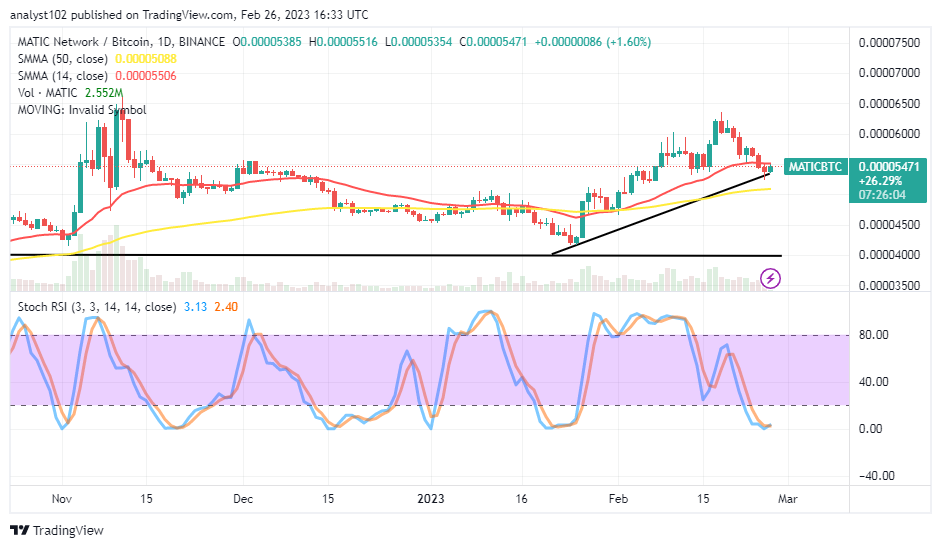
MATIC/BTC Price Analysis
In contrast, Polygon has run southward, nearly to a lower specific point against Bitcoin. The 14-day SMA indicator is above the 50-day SMA indicator. The bullish trend line has drawn northwardly past the bigger SMA trend line. The Stochastic Oscillators have dipped into the oversold region around the 3.13 and 2.40 levels. The base crypto is striving to find the baseline around the B0.00005000. Therefore, pushes to the upside direction will soon come to be in the near session.
Note: Cryptosignals.org is not a financial advisor. Do your research before investing your funds in any financial asset or presented product or event. We are not responsible for your investing results.
You can purchase Lucky Block here. Buy LBLOCK