Polygon (MATIC/USD) Price Encounters a Barrier at $1.30
Don’t invest unless you’re prepared to lose all the money you invest. This is a high-risk investment and you are unlikely to be protected if something goes wrong. Take 2 minutes to learn more
Polygon Price Prediction – February 12
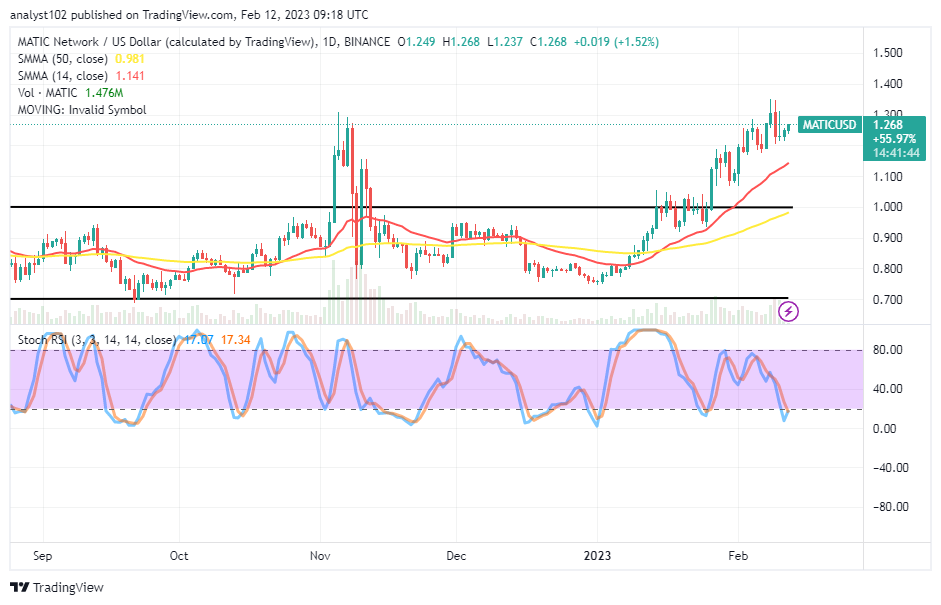
There have been prolonged-striving efforts in the MATIC/USD market buyers’ ability to push northward steadily slow against the long-awaited expectation of sellers to regain their stances between $1.40 and $1.30 points as the crypto’s price encounters a barrier around the smaller value line. The trading situation currently witnesses a 1.52 percent positive to indicate that some upward motions are ongoing.
MATIC/USD Market
Key Levels
Resistance levels: $1.40, $1.50, $1.60
Support levels: $1.10, $1, $0.90
MATIC/USD – Daily Chart
It is depicted on the MATIC/USD daily chart that the base-crypto-economic instrument encounters a barrier around the $1.30 level. The Stochastic Oscillators are in the oversold region, trying to cross their lines northbound at 17.07 and 17.34 levels. The 14-day SMA indicator is at a $1.141 value line over the $0.981 point of the 50-day SMA indicator. According to this technical assumption analysis, a smaller bullish trading candlestick indicates a buying opportunity is on the way.
Is it technically worthwhile to continue buying the MATIC/USD market to the upside?
Any intending buyer wishing to join the MATIC/USD market operation to the upside has to be wary of any reversal motion that can run volatility against the $1.20 level as the price encounters a barrier around the $1.30. That point appears to be a determining factor in obtaining sustained increased-moving pressures in the subsequent sessions. Long-position traders must be strategic in their approach, looking for upward momentum on the emergence of a bullish candlestick before executing a buying stance.
On the downside of the technical analysis of the MATIC/USD market activities, bears will need to be cautious of launching a sell order until another posture is derived from the Stochastic Oscillators in the overbought region or at a high range levels. In the maintain, resistance trading points around the $1.40 may be the maximal high line for a sell order position to resurface. Another way around this is if the 14-day SMA trend line breaks southward, causing a recurrence of sell orders.
MATIC/BTC Price Analysis
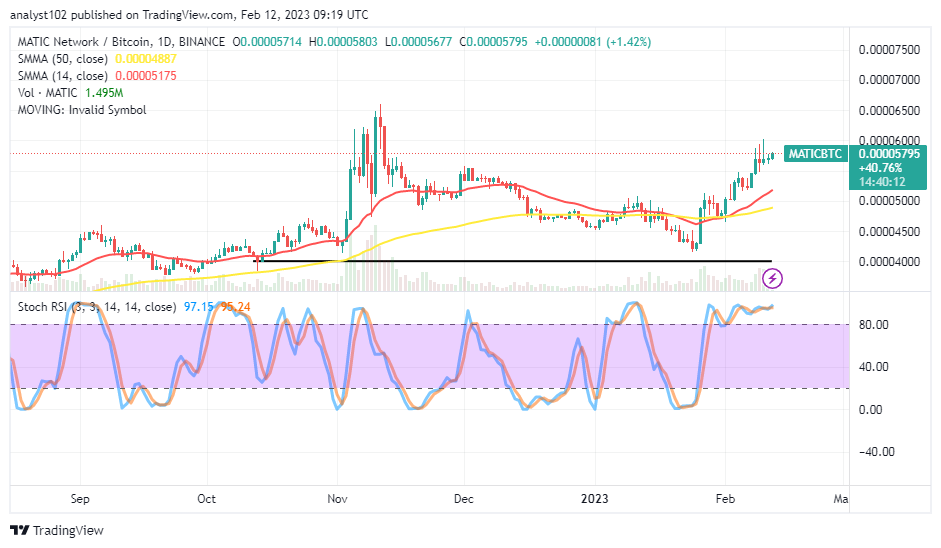
In contrast, Polygon remains to consolidate its features northward against Bitcoin’s trending ability over the buying signal side of the SMA trend lines. The 14-day SMA indicator is above the 50-day SMA indicator. Traders should be careful of an emergence of a long-legged bearish candlestick that can occur at any moment from now. The Stochastic Oscillators are in the overbought region, keeping a 95.24 red line and 97.15 blue line to signify the base crypto is still on course striving against its counter-trading crypto. However, there is a warning sign that upward-smooth runs are unlikely shortly.
Note: Cryptosignals.org is not a financial advisor. Do your research before investing your funds in any financial asset or presented product or event. We are not responsible for your investing results.
You can purchase Lucky Block here. Buy LBLOCK
