Polygon (MATIC/USD) Market Faces a Resistance Trade Condition
Estimated Reading Time: 3 minutes
Don’t invest unless you’re prepared to lose all the money you invest. This is a high-risk investment and you are unlikely to be protected if something goes wrong. Take 2 minutes to learn more
Polygon Price Prediction – February 5
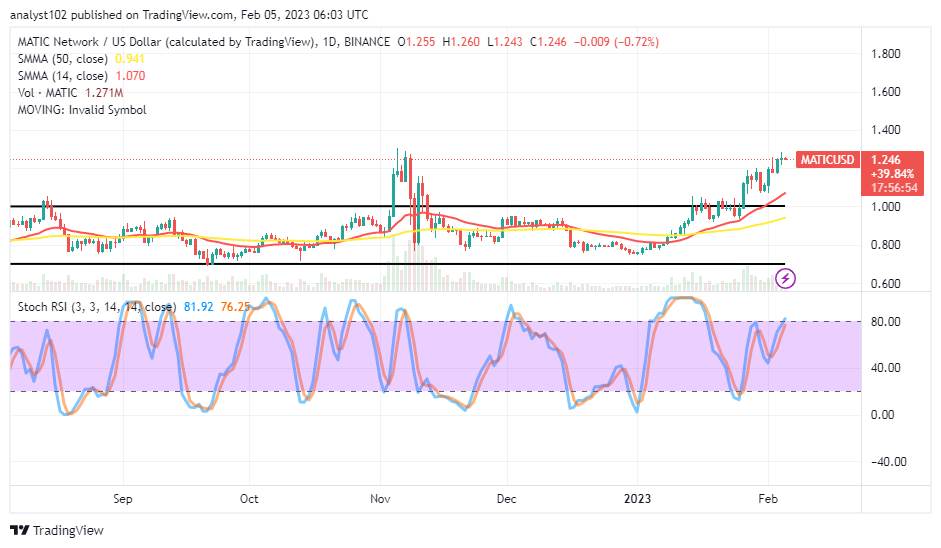
An overbought trading outlook has indicated being nearby in the MATIC/USD business operations as the crypto market faces a resistance trade condition. Currently, buying and selling activity strength is confined between the $1.260 and $1.243 value lines at a negative minute percentage rate of 0.72. It demonstrates that buyers will need to exert more pressure northward from their current bargaining capacity zone of $1.246 to a higher-trading spot.
MATIC/USD Market
Key Levels
Resistance levels: $1.40, $1.50, $1.60
Support levels: $1.05, $0.95, $0.85
MATIC/USD – Daily Chart
It is displayed on the MATIC/USD daily chart that the crypto market faces a resistance trade condition on the far buying signal side of the SMA trend lines. The 14-day SMA indicator is at $1.070 above the $ 0.941 of the 50-day SMA indicator. The upper horizontal drawn at the $1 level marks the critical value price that needs to breach southward to confirm the imminence of seeing falls in the subsequent sessions. The Stochastic Oscillators are at 76.25 and 81.92 levels, pointing toward the north.
Will the MATIC/USD market push upward more in opposing a massive correction?
A tremendous southward motion may resume soon after the MATIC/USD trade operation fails to break the overhead barrier lines at the $1.40 level as the crypto economy faces a resistance trade condition over a couple of sessions. From the technical reading outlook of the Stochastic Oscillators, it appears the rate of momentum gathering capacity of bulls is getting a reduction on a lighter mode. Therefore, longing position orders are to suspend for a while.
On the downside of the technical analysis, the MATIC/USD market sellers need to be strategic by being alerted to spot active reversal motion that can surface after the price faces a rejection below or around those resistance points stated above. It is that a retracement will occur quickly, while trading activity will be volatile in the coming days. in other words.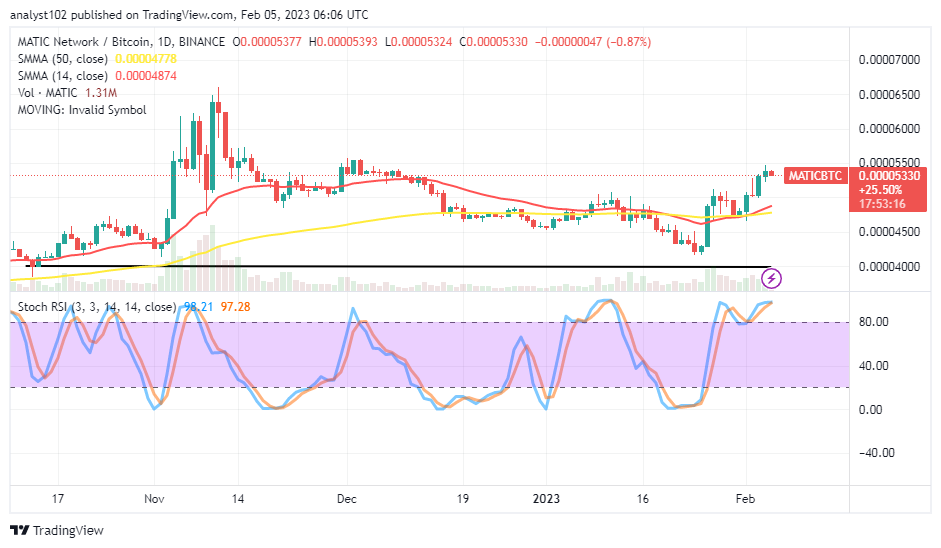
MATIC/BTC Price Analysis
In contrast, Polygon has seemingly pushed to a peak spot to face a resistance trade condition against the trending ability of Bitcoin. The 14-day SMA indicator has slightly crossed northward from the 50-day SMA indicator. The positioning of the Stochastic Oscillators in the overbought region at 97.28 and 98.21 levels suggests the probability of seeing the base crypto decreasing in its valuation, pairing with the counter-trading crypto. As of the writing of this technical piece, bears are likely to prevail over other positions in the near time.
Note: Cryptosignals.org is not a financial advisor. Do your research before investing your funds in any financial asset or presented product or event. We are not responsible for your investing results.
You can purchase Lucky Block here. Buy LBLOCK