Cosmos (ATOM/USD) Bullish Bias Emerging as Bears Lose Momentum
Estimated Reading Time: 3 minutes
Don’t invest unless you’re prepared to lose all the money you invest. This is a high-risk investment and you are unlikely to be protected if something goes wrong. Take 2 minutes to learn more

Prior to the current daily session, Cosmos (ATOM) had been trending downward, eventually finding solid support at the $2.55 level—a key zone where buying interest began to strengthen. From this point, bullish activity has started to build.
In today’s trading session, the bulls have made notable progress, driving a strong rebound in price. ATOM has gained approximately 12% so far, with the session opening near $2.70 and the market now trading above the $3.00 level.
This sharp recovery highlights renewed bullish momentum and suggests that the bears may be losing control of the market.
Cosmos (ATOM/USD) Market Data
- ATOM/USD Price Now: $3.05
- ATOM/USD Market Capitalization: $1.49 billion
- ATOM/USD Circulating Supply: 479 million ATOM
- ATOM/USD Total Supply: 479 million ATOM
- ATOM/USD CoinMarketCap Ranking: #52
Key Levels to Watch
- Resistance: $3.25, $3.50, $4.00
- Support: $2.70, $2.20, $2.00
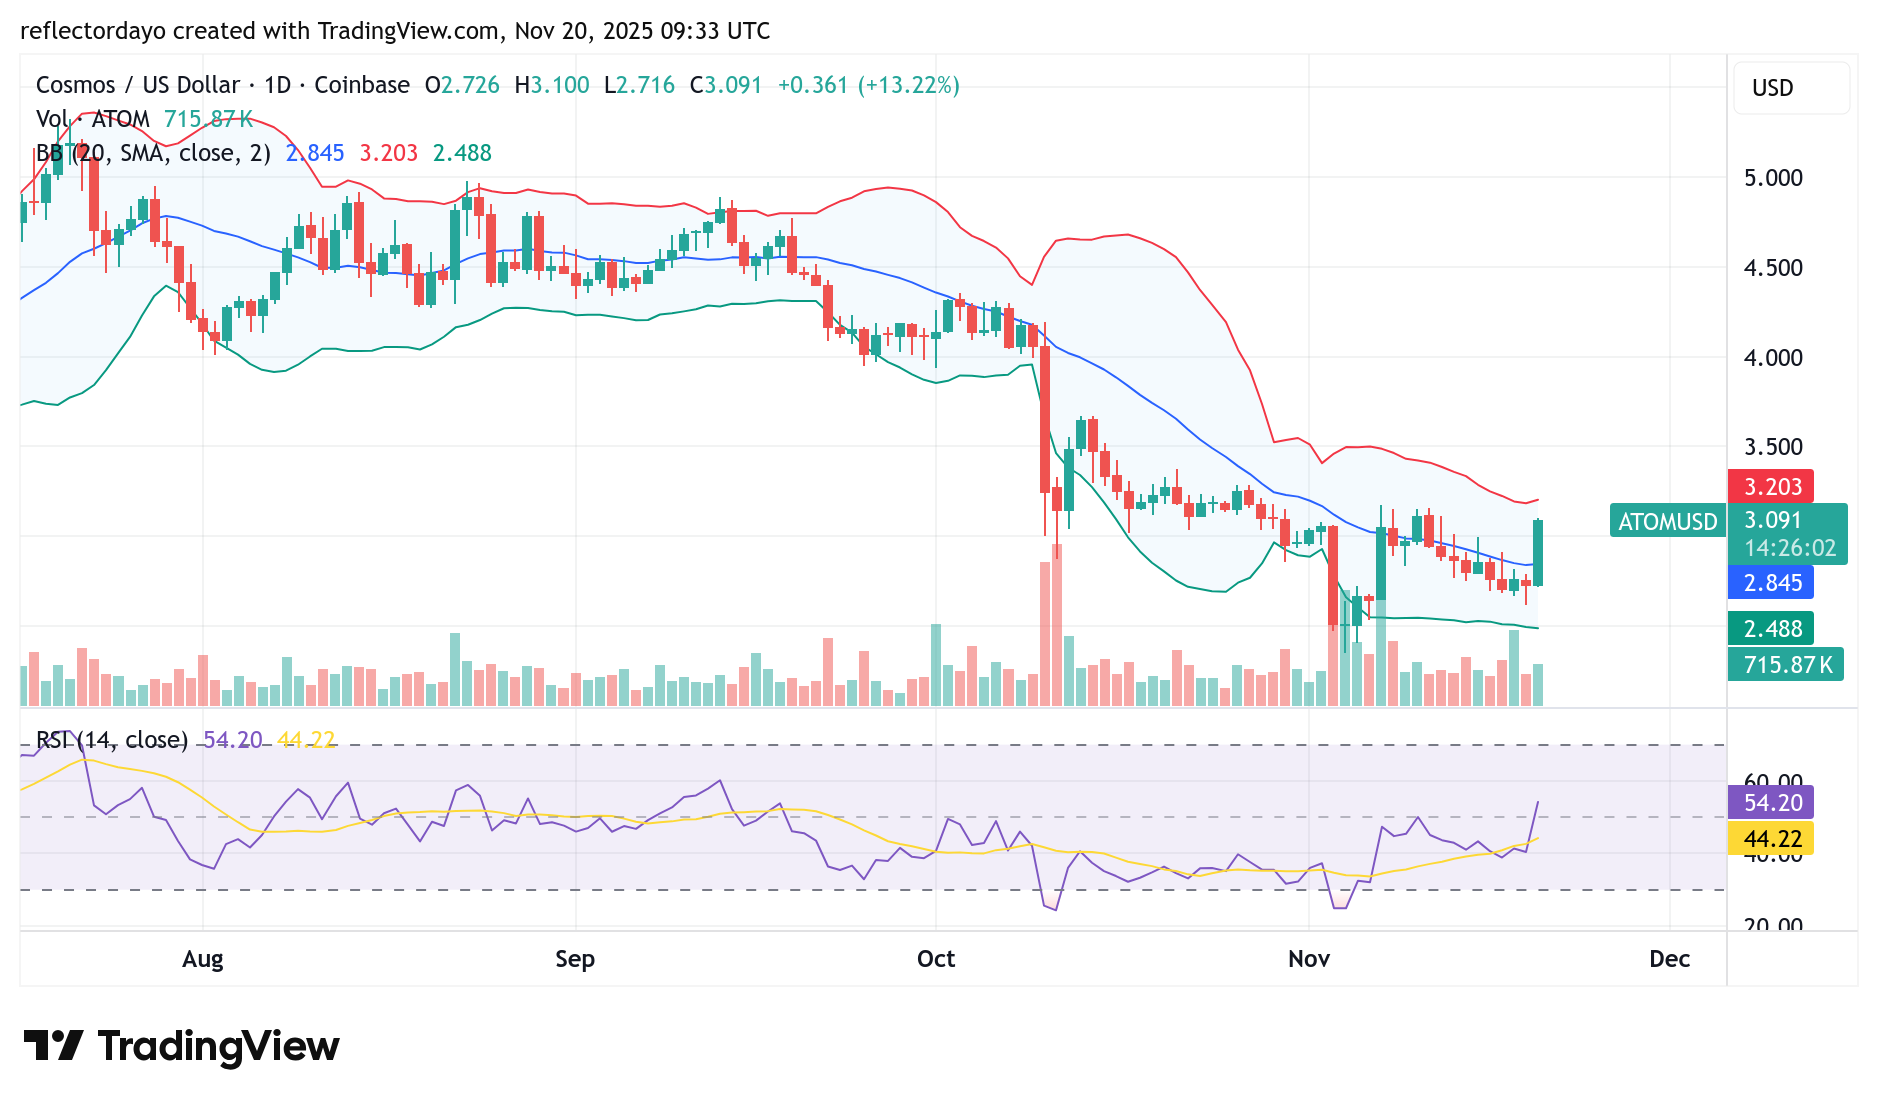
Cosmos (ATOM/USD) Daily Chart Analysis
Today’s candlestick on the daily chart forms a clear marubozu pattern, indicating strong bullish sentiment and a decisive upward move driven by buyers. This shows that Cosmos traders are largely aligned in their bullish bias for the session.
However, as price action moved above the critical $3.00 level, market participants began to show signs of caution. The hesitation reflects uncertainty as traders assess whether the bullish momentum can continue or if the market may pause before choosing its next direction.
Looking at the indicators, the accompanying volume histogram for today’s session does not reflect strong participation. The relatively weak trading volume in the crypto signal suggests that the current bullish push may not be fully supported by broad market conviction. As a result, a continuation of the rally may be limited in the near term.
If buyers maintain control at the $3.00 level, the market could shift into a consolidation phase while awaiting clearer momentum. For a confirmed bullish reversal on the broader trend, ATOM would need to break convincingly above the $3.50 resistance zone. However, given the current volume profile, achieving such a breakout may be challenging unless buying pressure strengthens.
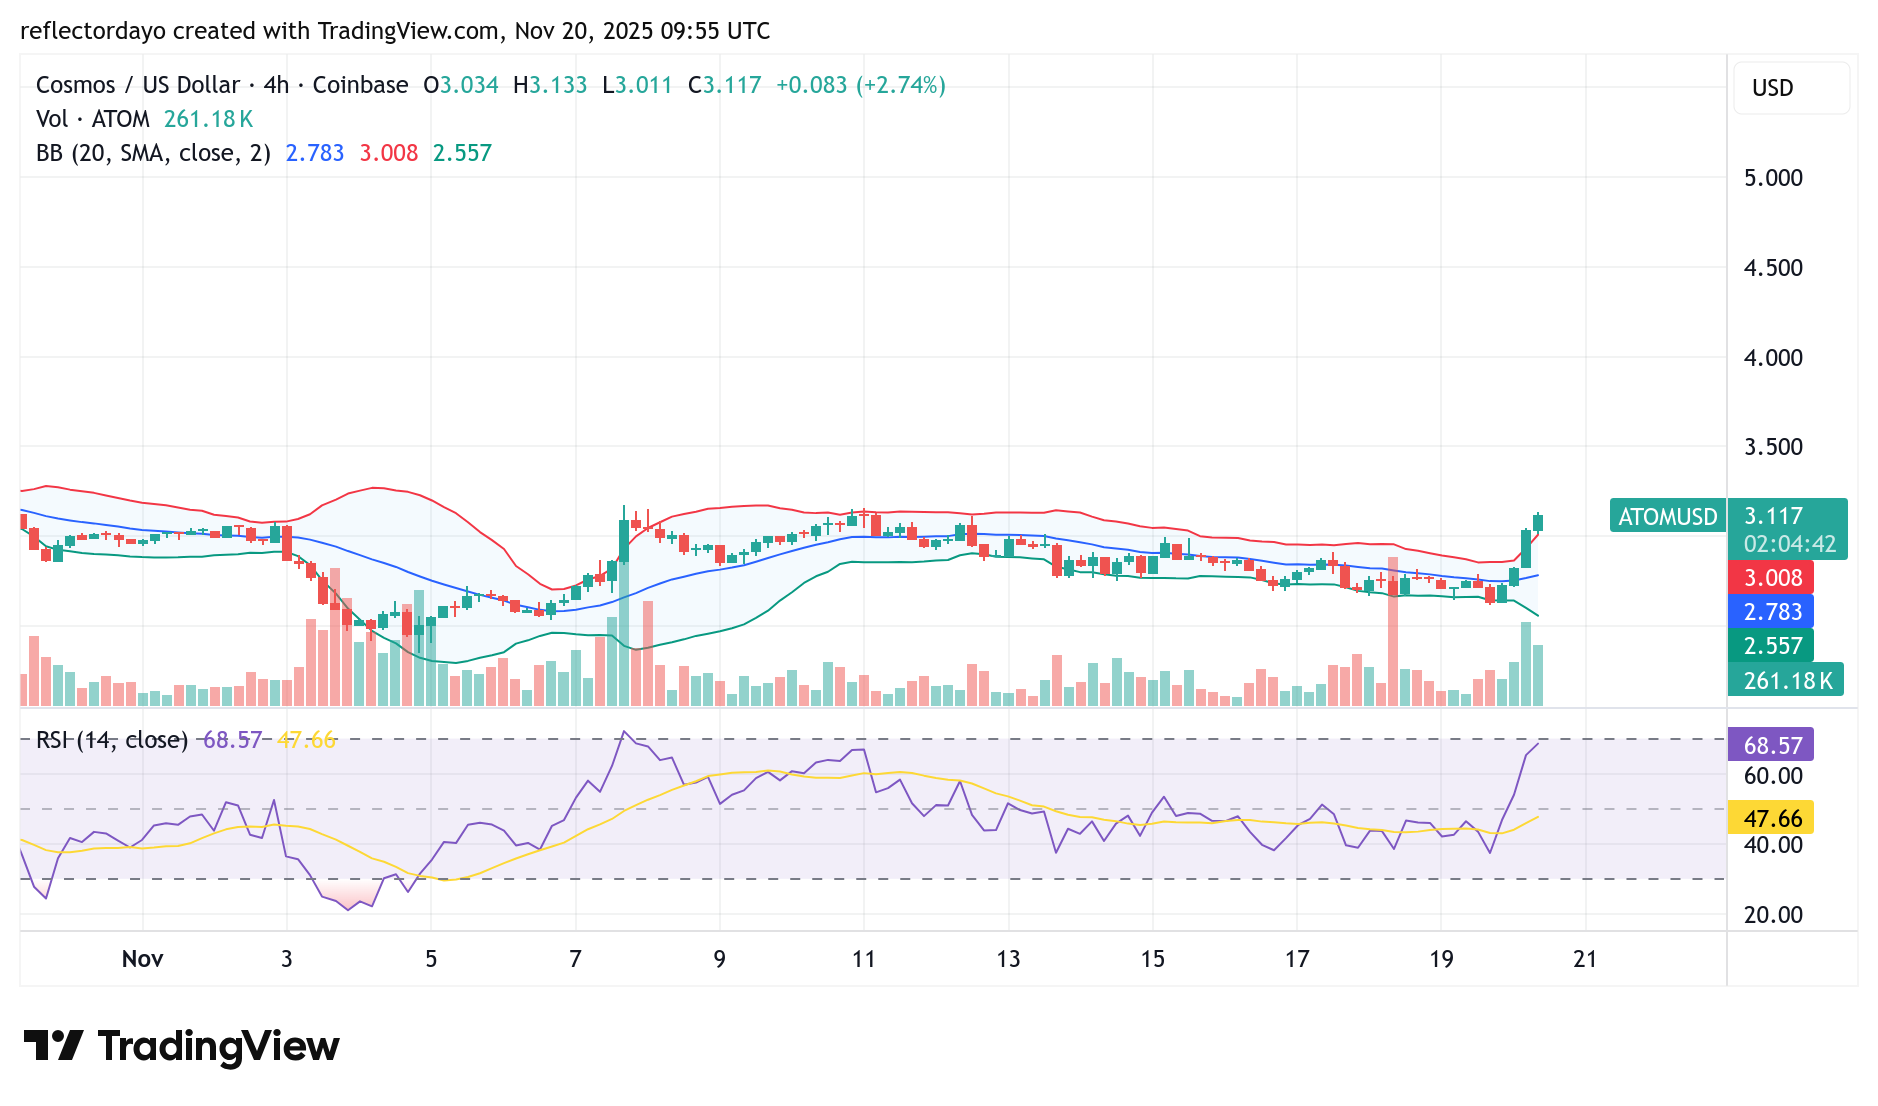
ATOM/USD 4-Hour Chart Outlook
On the 4-hour timeframe, bullish momentum has dominated today’s market structure, with buyers driving the price sharply upward until it breached the key $3.00 level. However, once the market crossed this threshold, traders became more cautious, leading to a noticeable slowdown in upward momentum.
This shift is reflected in the indicators: trading volume has begun to taper slightly, and the RSI has dipped marginally, signaling that bullish strength is easing at this level. These signs suggest that buyers may be pausing to reassess before committing to further upside movement.
The next few trading sessions will be crucial in determining whether the bullish trend will resume or if the market will transition into consolidation. Given the current conditions, a likely scenario is that ATOM may stabilize and move sideways around the $3.00 region while awaiting fresh momentum.