Polygon (MATIC/USD) Price Risks Losing Ground at $1.20
Estimated Reading Time: 3 minutes
Don’t invest unless you’re prepared to lose all the money you invest. This is a high-risk investment and you are unlikely to be protected if something goes wrong. Take 2 minutes to learn more
Polygon Price Prediction – January 29
Presently, it has exhibited that forces in the buying system of the MATIC/USD market have exhausted as the crypto’s price is risking losing points at $1.20. Buying and selling actions have maintained a positive percentage rate of 1.31 between $1.166 and $1.129. That means that the assumed condition of losing momentum necessitates a measure in the direction of executing short orders at this time.
MATIC/USD Market
Key Levels
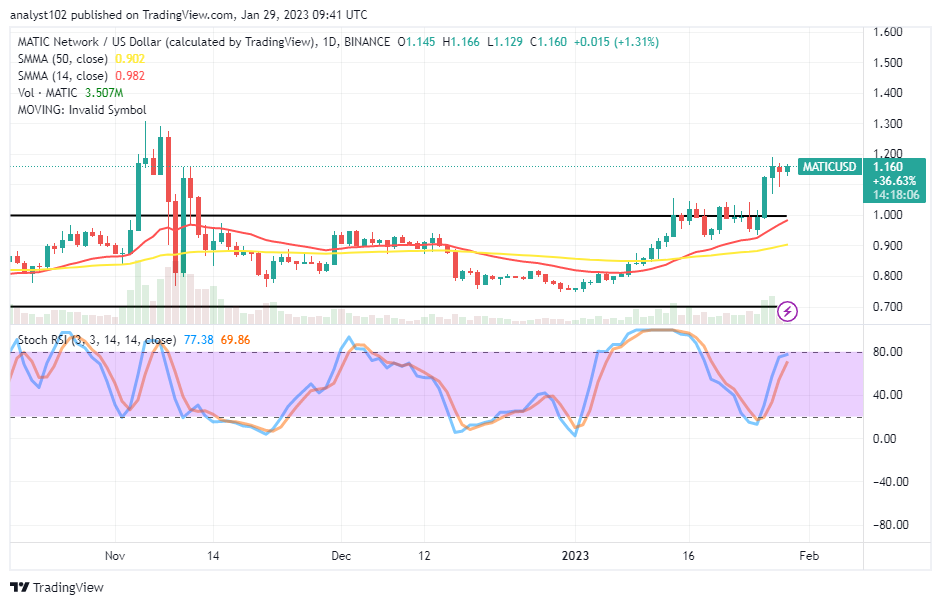
Resistance levels: $1.20, $1.30, $1.40
Support levels: $1.05, $1, $0.95
MATIC/USD – Daily Chart
The MATIC/USD daily chart shows that the crypto-economic price risks losing ground at $1.20 above the SMA trend lines. The 50-day SMA indicator is at $0.902, just below the 14-day SMA indicator’s value line of $0.982. The upper horizontal line is a vital zone against lowering expectations away from the current high trading capacity. In the long run, the Stochastic Oscillators have traveled northbound from the 20 to 69.86 and 77.38 levels. And they are seemingly managing to close their lines as of the time of writing.
Will the MATIC/USD market not soon fall to a declining trend at $1.20?
About three days running, the MATIC/USD market operation has witnessed candlesticks signaling rejections closely beneath the $1.20 resistance level, as observed. New execution of the desired position order must halt around that time, especially if the processes to the upside risk collapsing when attempting to surge vigorously afterward. It is uncertain that bulls will able to sustain pushes through above the point in question.
On the downside, another wave of formation has been accumulating around the $1.20 resistance level, according to technical analysis. Bears have to be on the lookout for entry supported by active motions. In the wake of that assumption materializing, investors will have to take off part of their position in profits. In the long run, a reading of the Stochastic Oscillators near dip-trading levels will signal another round of purchasing if the price corrects purposefully to test a point around or around the 14-day SMA.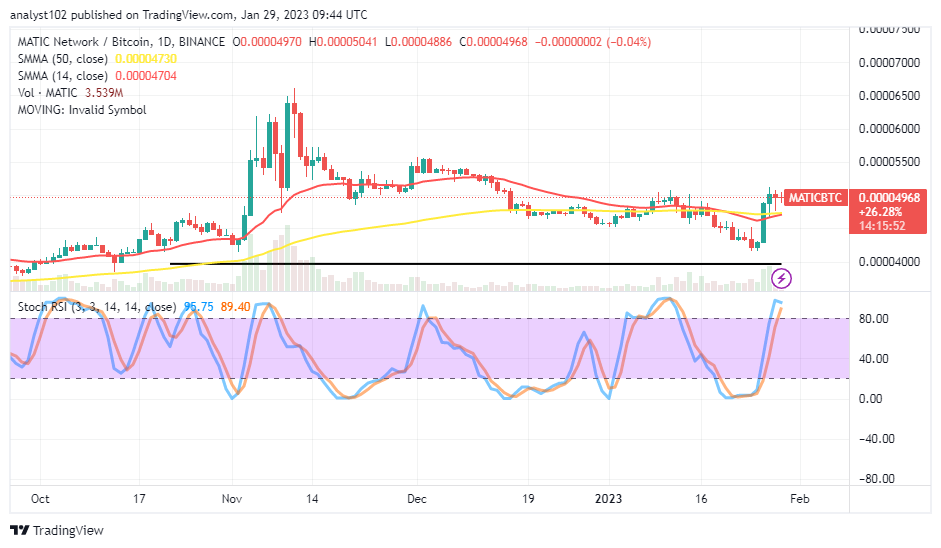
MATIC/BTC Price Analysis
In contrast, Polygon’s trending catalyst against Bitcoin has reached a peak trading zone, promising to risk losing ground possibly in the following sessions. The 14-day SMA indicator has touched the 50-day SMA indicator from underneath. The Stochastic Oscillators are in the overbought region, positioning at 89.40 and 95.75 levels. There may soon be a loss of momentum in the pricing of the base cryptocurrency. A downward break of the SMA trend lines indicates the probability of a new sell-off event.
Note: Cryptosignals.org is not a financial advisor. Do your research before investing your funds in any financial asset or presented product or event. We are not responsible for your investing results.
You can purchase Lucky Block here. Buy LBLOCK