Polygon (MATIC/USD) Market Is Holding Values at $1
Estimated Reading Time: 3 minutes
Don’t invest unless you’re prepared to lose all the money you invest. This is a high-risk investment and you are unlikely to be protected if something goes wrong. Take 2 minutes to learn more
Polygon Price Prediction – January 22
Over some days, it has been that the MATIC/USD market activity has been holding values around $1. And the situation appears, revealing an indecision method executed by buyers and sellers to feature in the high and low lines of $0.997 and $0.982, respectively. The price rate is at a minute negative of 0.40 on average.
MATIC/USD Market
Key Levels
Resistance levels: $1.10, $1.15, $1.20
Support levels: $0.85, $0.80, $0.75
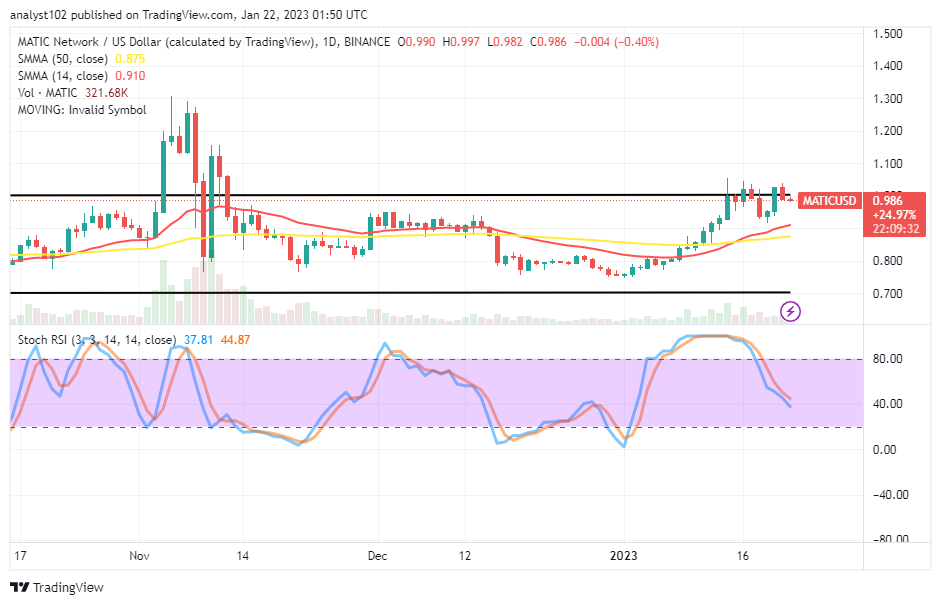
MATIC/USD – Daily Chart
The MATIC/USD daily chart showcases the crypto market is holding values around the $1 trading zone, going into some days’ sessions. And the condition is somewhat gradually metamorphosing into a convergence closely over the trend lines of the SMAs. The 14-day SMA indicator is at $0.910 over the $0.875 value line of the 50-day SMA indicator. The upper horizontal line drew alongside the point in question, marking it as a crucial trading sport. The Stochastic Oscillators have crossed their lines southbound from the overbought region to position around 44.87 and 37.81 levels.
Will the MATIC/USD market activity remain holding values around $1 for more days or weeks/?
It might not be clear to project the actual time in either days or weeks for the change of definite market direction the MATIC/USD trade can go as it is holding values around $1 for quite a couple of sessions. Nevertheless, a sudden reliable upsurge to the upside or the downside at a point will potentially generate more ups or downs in compliance with an overriding move afterward. Meanwhile, long-position placers can get positioned by executing a buy limit order around the SMA points if the price needs to rebuild a baseline around them shortly.
On the downside of the technical analysis, it currently appears that a relative loss momentum mustering is on a note of losing as the MATIC/USD market bears fail to intensify efforts to revolt the activities of buyers around the $1 psychological trading axis. Based on this, it would be technically preferable for sellers to wait for several rounds of what will be the reading posture of the Stochastic Oscillators at higher level ranges, signaling a southbound-crossing mode, before considering a shorting order.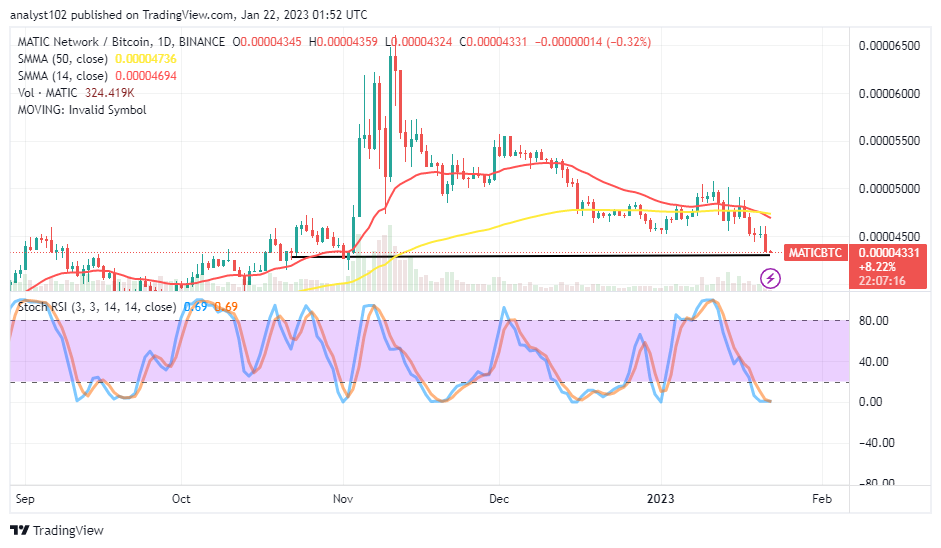
MATIC/BTC Price Analysis
In contrast, Polygon yet appears, holding values to the downside against the trending ability of Bitcoin underneath the trend lines of the SMAs. The 14-day SMA indicator moves southward, attempting to cross the 50-day SMA indicator to the south side. The formation of bearish candlesticks has continued to feature in a sequential pattern against some of the notable previous strategic base points made for swing highs. The Stochastic Oscillators are dipped into the oversold region, keeping the levels of 0.69 and 0.69. Sellers may stay off at this point because a bullish candlestick can emerge in no time to cause a bear’s trap.
Note: Cryptosignals.org is not a financial advisor. Do your research before investing your funds in any financial asset or presented product or event. We are not responsible for your investing results.
You can purchase Lucky Block here. Buy LBLOCK