Bancor (BNTUSD) Continues in Sideways Movement
Estimated Reading Time: 3 minutes
Don’t invest unless you’re prepared to lose all the money you invest. This is a high-risk investment and you are unlikely to be protected if something goes wrong. Take 2 minutes to learn more
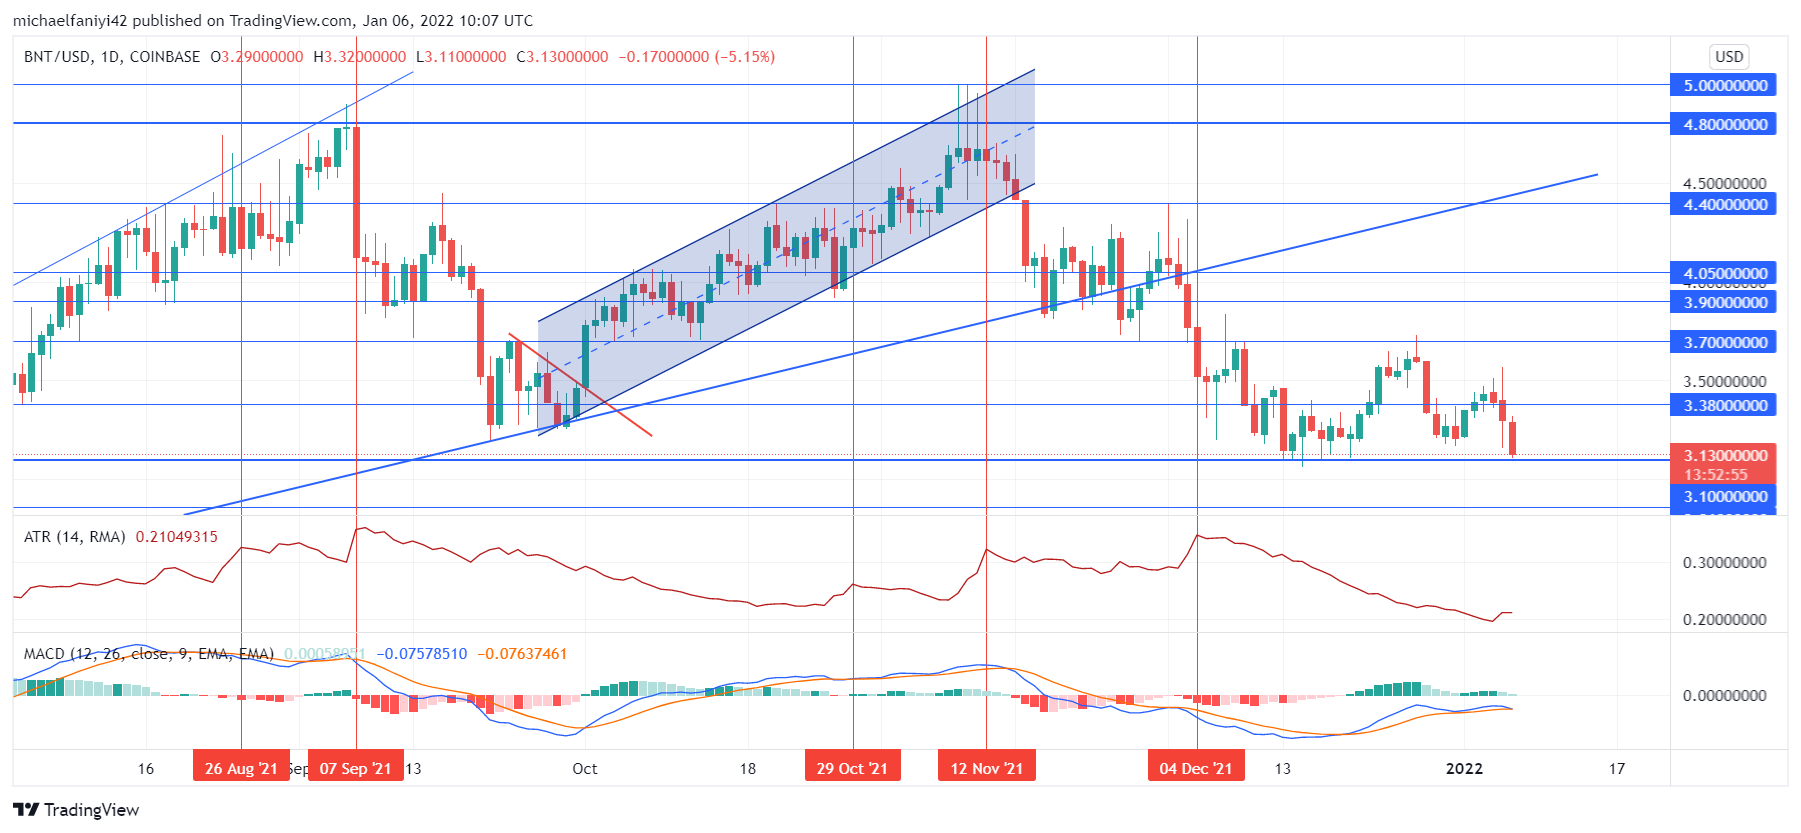
BNTUSD Analysis – Price Continues in a Ranging Phase Below $3.700
BNTUSD continues to undulate between key levels after it fails to make it past the $3.700 key level. The latest attempt by the coin to break its trend of sideways movement comes on the 27th of December 2021. The price rose to test the $3.700 key level but was rejected in an instant. This led to another drop towards the $3.100 support level. Subsequent attempts to break through failed, and currently, the market is back at the support level and continues in a sideways movement.
BNTUSD Key Levels
Resistance Levels: $3.700, $4.400, $4.800
Support Levels: $2.860, $3.100, $3.380
BNTUSD has generally been erratic with volatility as it advances. Sellers, The market can be seen to display a surge in volatility when prices drop. All the notable instances that happened last year were on the 26th of August, the 7th of September, the 29th of October, the 12th of November, and the 4th of December. In all these instances, it was only on the 29th of October that the market displayed volatility in an upward direction.
This means that depressing forces have been very active in the market, pushing it lower at the slightest opportunity despite the struggles of the market to climb upwards. Since prices dropped below $3.700 with a surge in volatility on the 4th of December, volatility has been in a downtrend as shown by the Average True Range indicator. A slight increase in volatility can be seen as the price now drop from the $3.380 price level to continue in a sideways movement.

Market Expectation
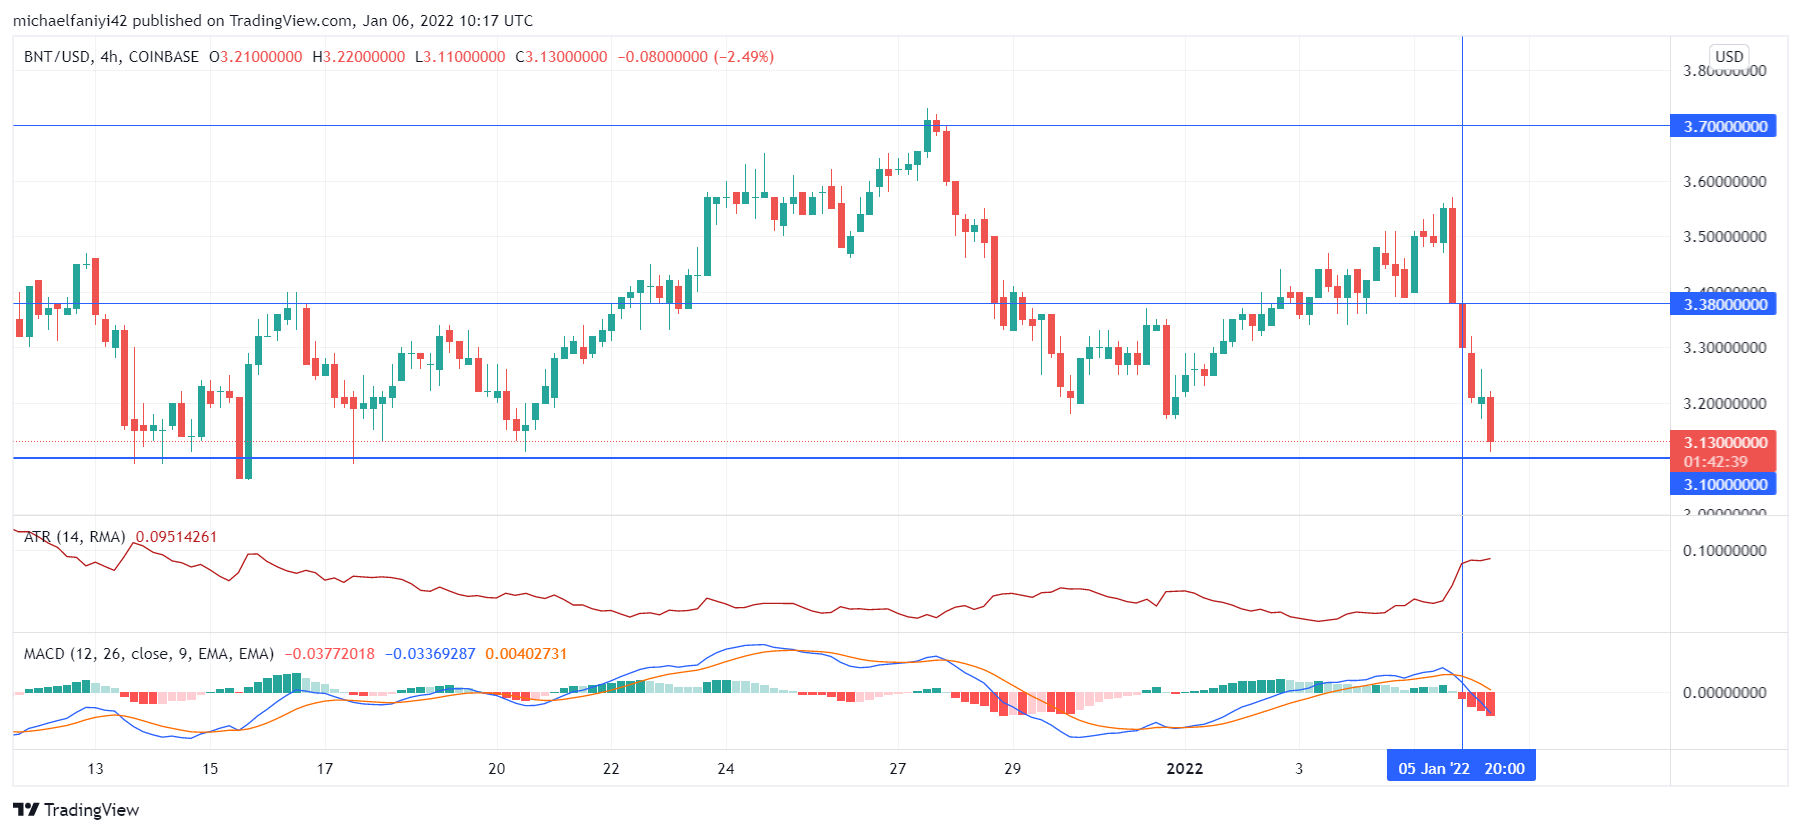
The 4-hour chart magnifies what is currently happening in the market. On the 4-hour chart, a surge in volatility can be seen as the price drops. This has led to a sudden switch of the green histogram bars to red on the MACD (Moving Average Convergence Divergence) chart. The signal lines have crossed each other downward also. The price has dropped to $3.100 now and it is expected to rise back to $3.700 as BNTUSD continues in a sideways movement.
You can purchase crypto coins here: Buy Tokens
Note: Cryptosignals.org is not a financial advisor. Do your research before investing your funds in any financial asset or presented product or event. We are not responsible for your investing results.