Uniswap (UNI/USD) Price Averages $8 Resistance
Estimated Reading Time: 3 minutes
Don’t invest unless you’re prepared to lose all the money you invest. This is a high-risk investment and you are unlikely to be protected if something goes wrong. Take 2 minutes to learn more

Free Crypto Signals Channel
Uniswap Price Prediction – July 20
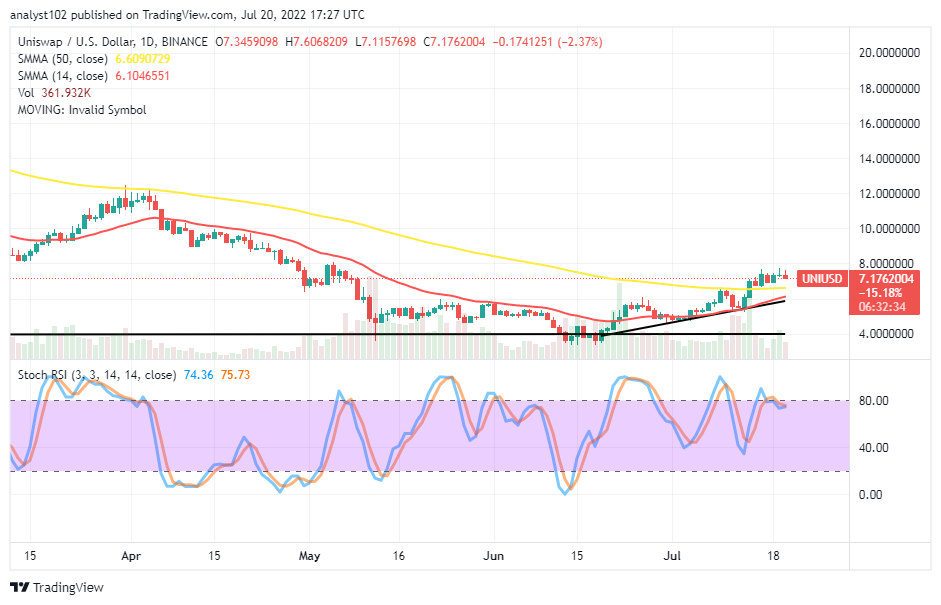
The recent spiraling moves in the UNI/USD market operations have brought the trading situation to the point of letting the crypto-economic price average the $8 resistance line. The crypto trade has a negative percentage rate of 2.37, trading around $7, as of writing today.
UNI/USD Market
Key Levels:
Resistance levels: $8, $9, $10
Support levels: $6, $5, $4
UNI/USD – Daily Chart
The UNI/USD daily chart showcases the crypto-economic price averages at the $8 resistance level as it trades over the trend lines of the SMAs. The 14-day SMA indicator has bent northward near underneath the 50-day SMA indicator. A short bullish trend line drew closely beneath the smaller SMA, marking the bottom path to the upside. The Stochastic Oscillators are around the 80 range. Variant candlesticks have formed between the buy signal of the bigger SMA and the resistance point of the $8, showcasing a convergence pattern.
Will the UNI/USD market bears regain market control beneath the $8 resistance soon?
All seems to be getting set for the UNI/USD market bears to regain control as the crypto-economic price averages the $8 resistance level. It currently appears technically unsafe to add more to buying orders as the price is trading over the trend lines of the SMAs. The market may soon move into a necessary correction toward finding support around the $6 level in the long run.
On the downside of the technical analysis, the price tends to run downward in a slow-and-steady moving nature from beneath the $8 resistance level. The critical trading level to the downside is at $6. It can be a while before bears exert pressure to break down at the value line. Even if it eventually has to revisit it. However, at the same point, bulls may also endeavor to push back northward, and a bullish candlestick will have to occur for confirmation before considering a re-launch of buying order.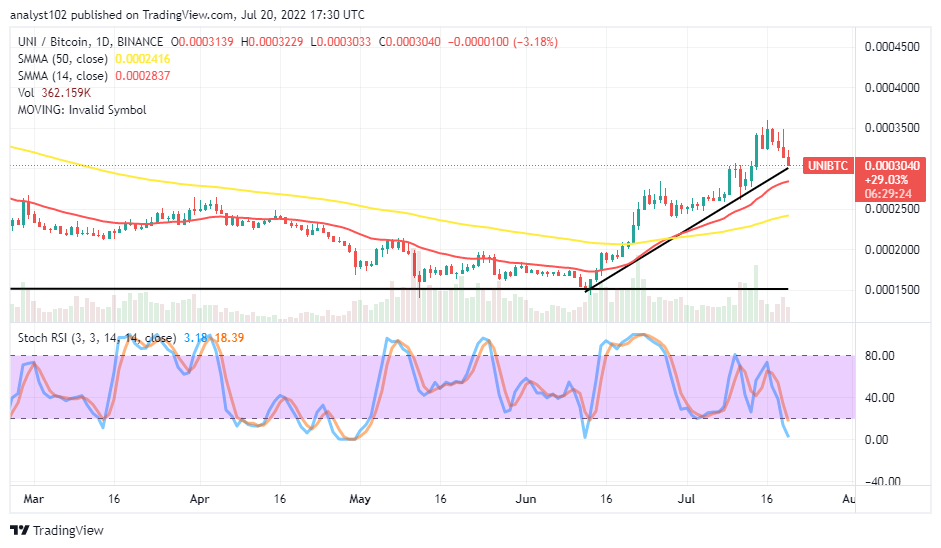 UNI/BTC Price Analysis
Uniswap has elongated its trending catalyst against Bitcoin over the buying signal side of the SMAs. The cryptocurrency pair price averages the smaller SMA as it runs into a correction after hitting resistance around the B0.000350 as currently trades around B0.0003040. The 14-day SMA indicator is above the 50-day SMA indicator. The Stochastic Oscillators have turned southbound, gradually attempting to enter the oversold region. A candlestick needed to form against the smaller SMA trend line sustainably around B0.0002837 to signify the base crypto will be pushed back into depression trending against the flagship counter crypto.
Note: Cryptosignals.org is not a financial advisor. Do your research before investing your funds in any financial asset or presented product or event. We are not responsible for your investing results.
“Lucky is up more than 50% today but still more than 430% from All Time Highs!
The opportunity to bank BIG is now!
You can purchase Lucky Block here. Buy LBlock