Polkadot (DOT) Hovers Above $25 Support as Sellers Threaten to Short
Estimated Reading Time: 2 minutes
Don’t invest unless you’re prepared to lose all the money you invest. This is a high-risk investment and you are unlikely to be protected if something goes wrong. Take 2 minutes to learn more
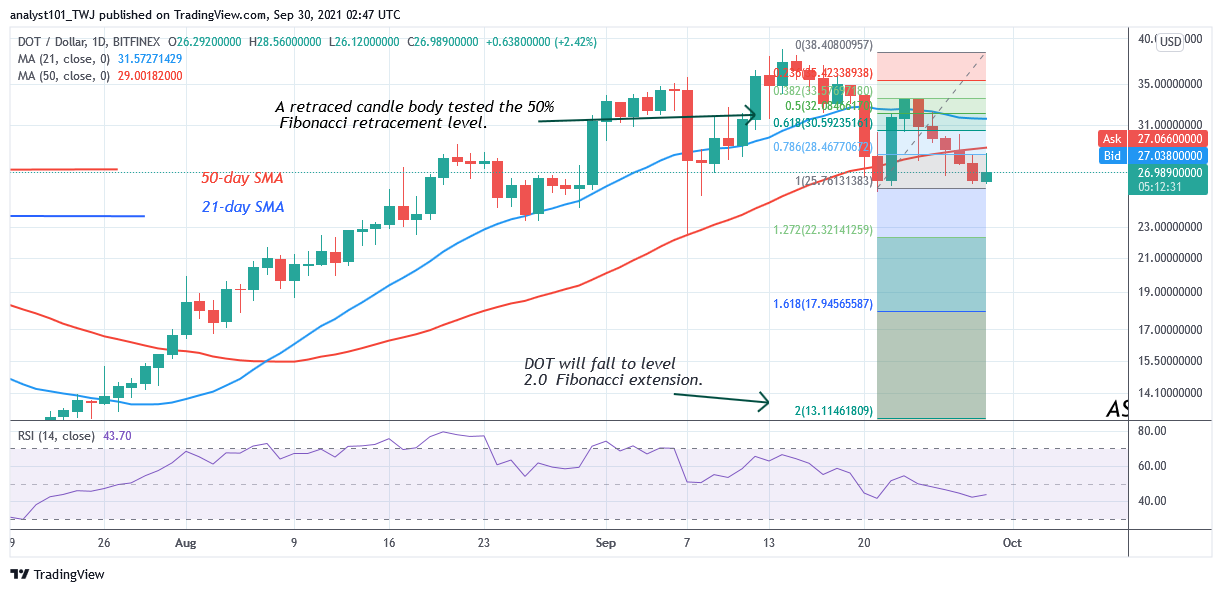

Polkadot (DOT) Long-Term Analysis: Bearish
Since September 24, the upward move above the moving average has been interrupted as the altcoin declined. Today, crypto has fallen to the previous low at $25.52. Buyers are defending the current support as the altcoin resumes upward. However, if the bears break below the current support, the downtrend will resume. Meanwhile, on September 21 downtrend; a retraced candle body tested the 50% Fibonacci retracement level. The retracement indicates that DOT/USD will fall to level 2.0 Fibonacci extension or level $13.11.
Polkadot (DOT) Indicator Analysis
The crypto’s price is below the moving averages suggesting a further downward movement of the coin. DOT price is at level 43 of the Relative Strength Index period 14. It indicates the crypto is in the downtrend zone and below the centerline 50. The 21-day SMA and the 50-day SMA are sloping downward indicating the downtrend.
Technical indicators:
Major Resistance Levels – $48, $52, $56
Major Support Levels – $32, $28, $24
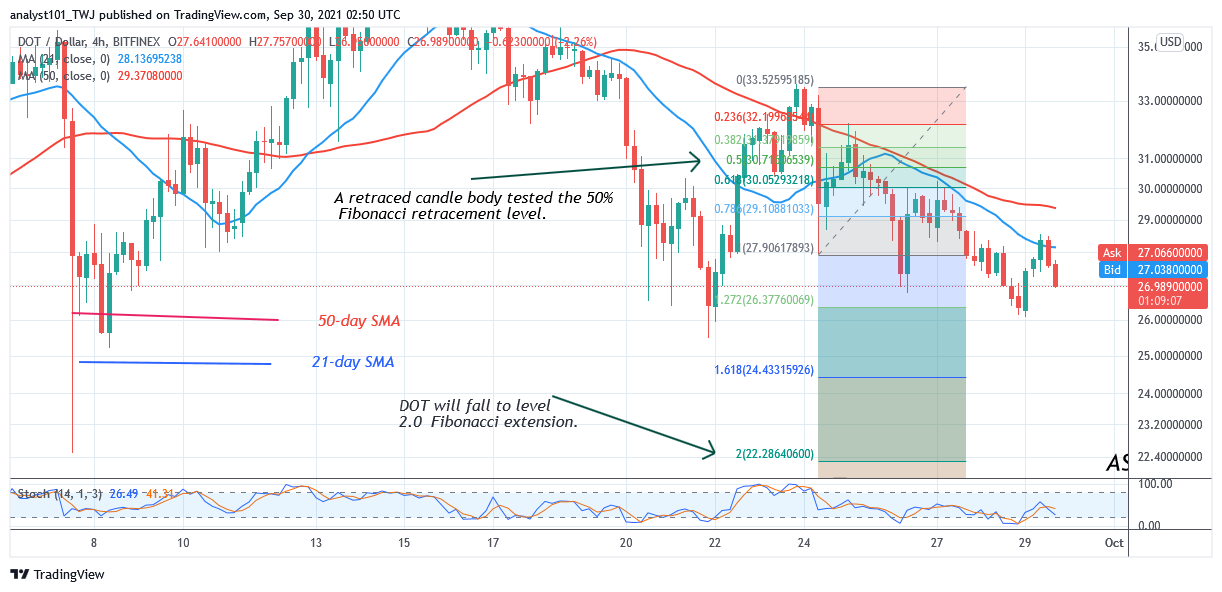
What Is the Next Direction for Polkadot (DOT)?
On the 4-hour chart, Polkadot is in a downward move. DOT price is making a series of lower highs and lower lows. Today, the market is making a lower high as the altcoin faces rejection. The selling pressure has resumed. Meanwhile, on the September 24 downtrend, a retraced candle body tested the 50% Fibonacci retracement level. The retracement indicates that DOT will fall to level 2.0 Fibonacci extension or level $22.28.
You can purchase crypto coins here. Buy Tokens
Note: Cryptosignals.org is not a financial advisor. Do your research before investing your funds in any financial asset or presented product or event. We are not responsible for your investing results