Polkadot (DOT) Breaks Above $34 Resistance, Faces Rejection at $38 High
Estimated Reading Time: 2 minutes
Don’t invest unless you’re prepared to lose all the money you invest. This is a high-risk investment and you are unlikely to be protected if something goes wrong. Take 2 minutes to learn more
Polkadot (DOT) Long-Term Analysis: Bearish
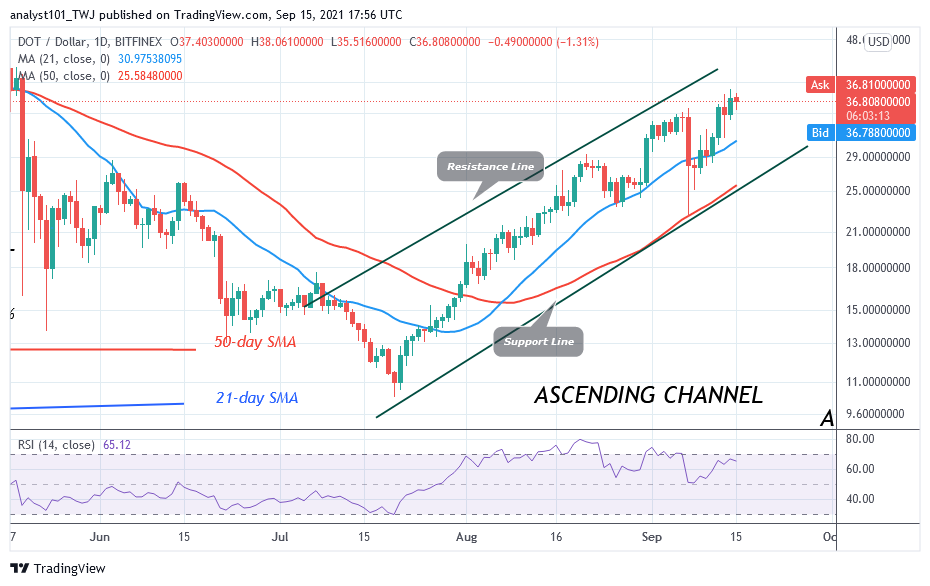
Presently, Polkadot’s (DOT) price has reached a high of $38 after recovering from the recent breakdown. The uptrend is hampered at the recent high of $38. On September 13, buyers could not break above the $38 resistance as the crypto was repelled. The coin fell to the low of $33 as bulls bought the dips. Today, the bulls are retesting the resistance to break above it.
Polkadot (DOT) Indicator Analysis
Polkadot has fallen to level 64 of the Relative Strength Index period 14. It indicates that DOT price is in the uptrend zone and capable of rising on the upside. The 21-day SMA and the 50-day SMA are sloping upward indicating the uptrend. DOT price is likely to rise on the upside as price is above the moving averages.
Technical indicators:
Major Resistance Levels – $48, $52, $56
Major Support Levels – $32, $28, $24
What Is the Next Direction for Polkadot (DOT)?
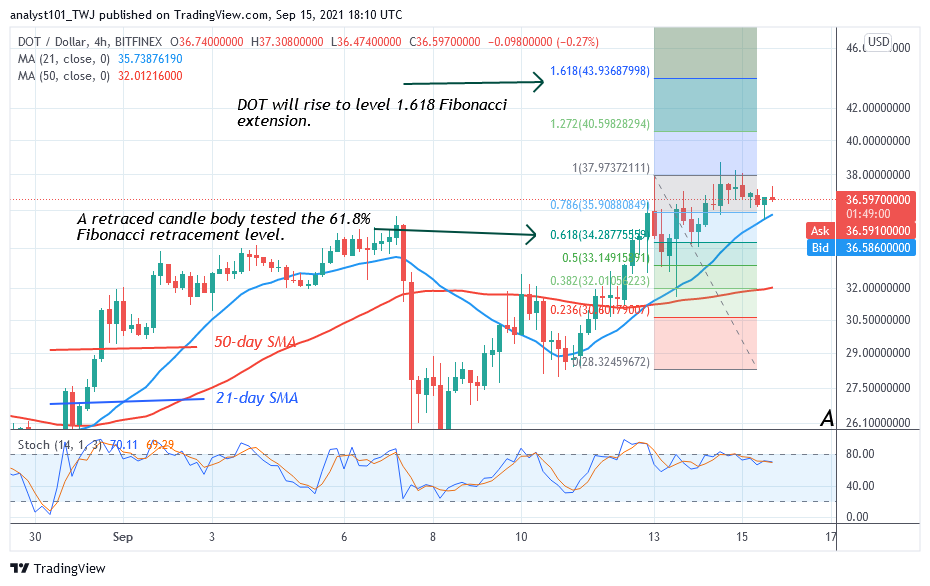
Polkadot is in an upward move. The crypto is battling to break the resistance at $38 which has proved difficult. Meanwhile, on the September 13 uptrend, a retraced candle body tested the 61.8% Fibonacci retracement level. The retracement indicates that DOT will rise to level 1.618 Fibonacci extension or level $43.93. This bullish scenario is possible if price breaks above the recent high.
You can purchase crypto coins here. Buy Tokens
Note: Cryptosignals.org is not a financial advisor. Do your research before investing your funds in any financial asset or presented product or event. We are not responsible for your investing results