Top Trending Coins for May 31: PI, WCT, WIF, SOLV, TST
Estimated Reading Time: 6 minutes
Don’t invest unless you’re prepared to lose all the money you invest. This is a high-risk investment and you are unlikely to be protected if something goes wrong. Take 2 minutes to learn more
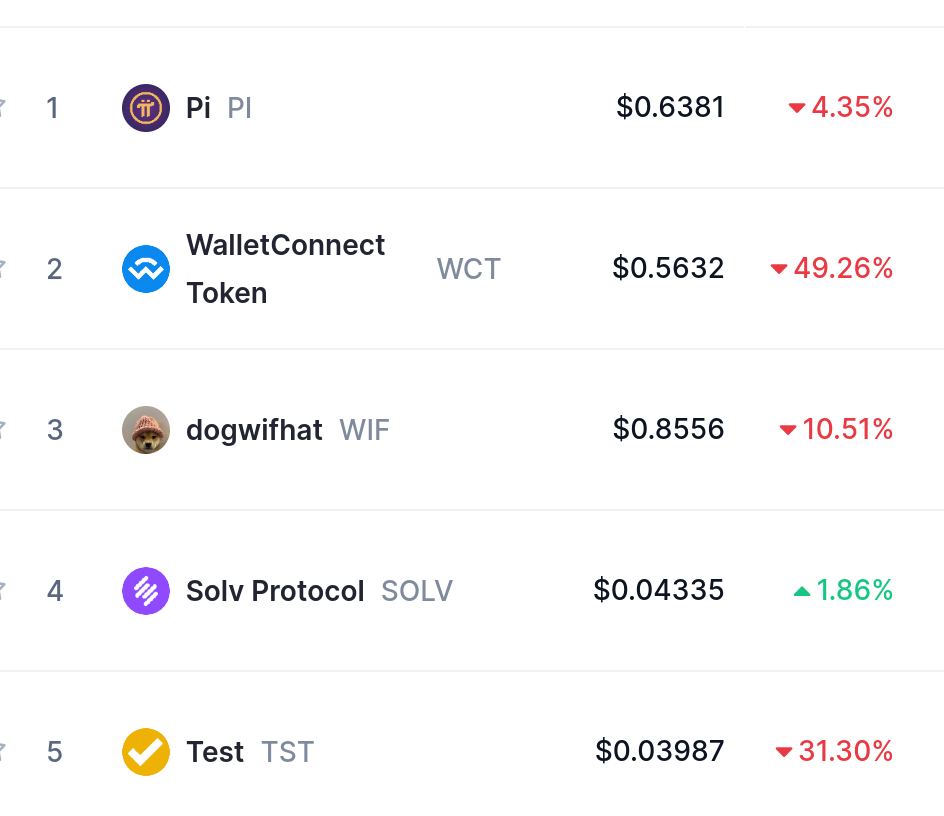
Today’s crypto market is largely characterized by a wave of downward volatility, as bearish momentum sweeps across multiple assets. Among the top-performing tokens, PI Network stands out with relatively mild downside movement, showing resilience despite broader market weakness.
The current sell-off has sparked heightened volatility across several charts under review. However, this strong bearish wave may pave the way for potential bullish recoveries, particularly as traders seek to capitalize on oversold conditions. The volatility could trigger renewed buying interest, setting the stage for short-term rebounds.
Let’s now break down the technical outlook for each of the key markets individually.
PI Network (PI)
Major Bias: Bearish
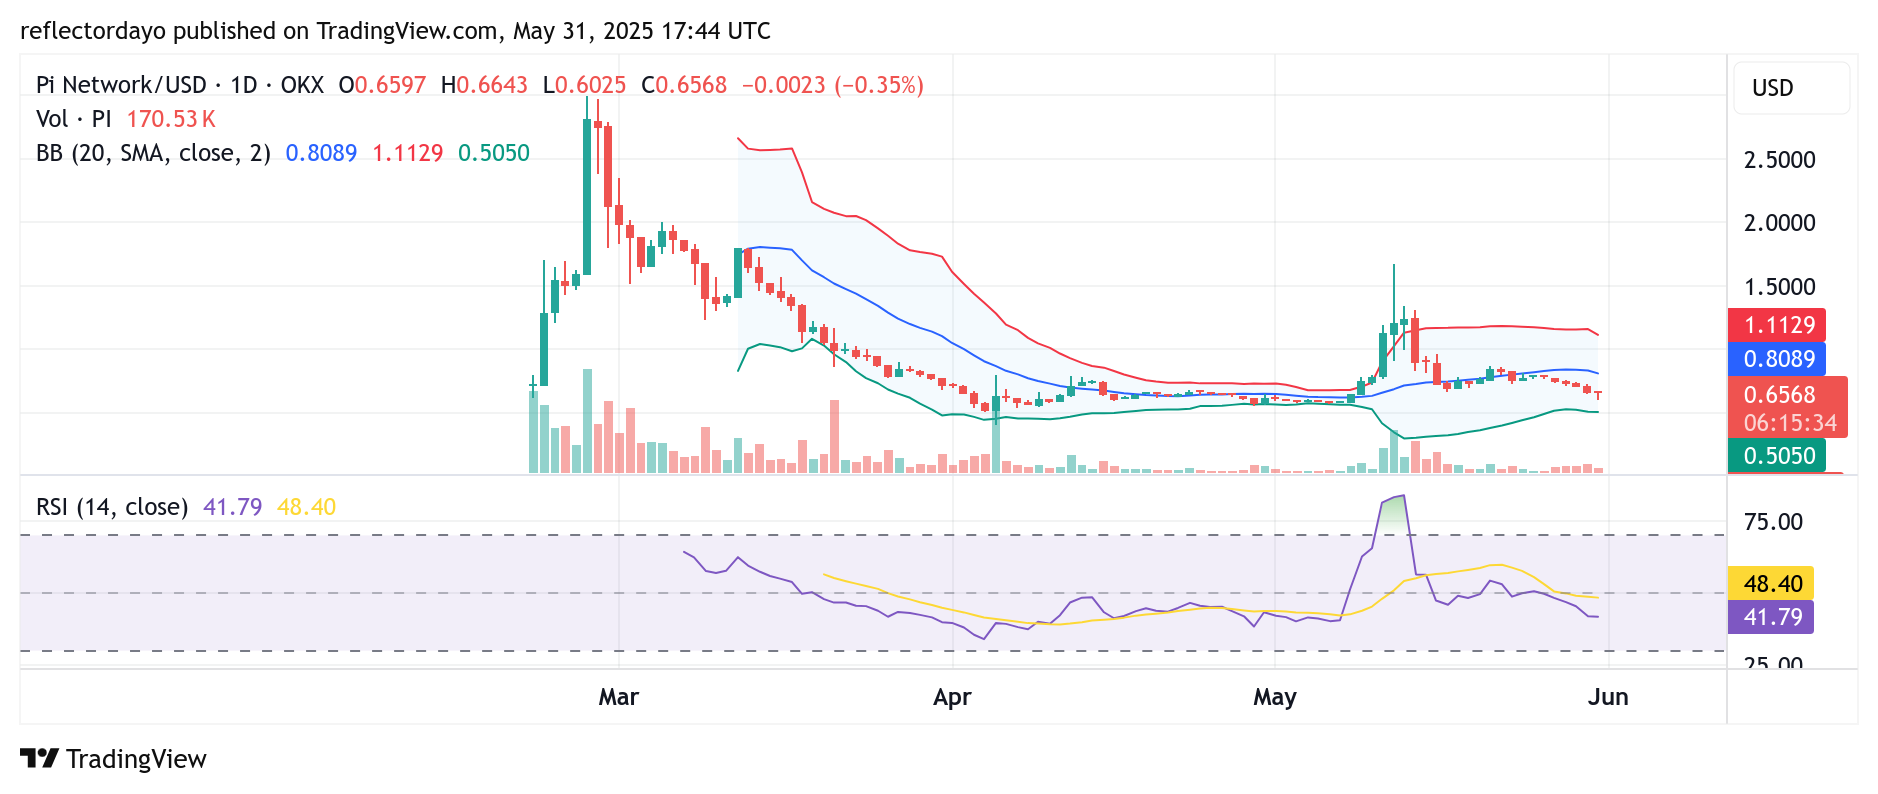
The Pi Network market continues to reflect the aftermath of a significant trading spike that occurred in early May. During that period, the token experienced a strong bullish rally, pushing the price to a peak of approximately $1.69—well above the key $1.50 level.
However, this surge was short-lived, as an equally aggressive wave of selling pressure followed, wiping out much of the earlier gains. The market subsequently declined, finding a new support base around the $0.70 level—still notably higher than its previous support near $0.56.
Currently, the bearish momentum appears to be waning. The presence of a long lower shadow on the latest daily candlestick suggests emerging bullish sentiment at these lower price levels. At the current trading price of around $0.65, sellers are beginning to show signs of exhaustion—even before retesting the former support at $0.56. This could signal an early shift in momentum, potentially paving the way for a bullish rebound.
Current Price: $0.65
Market Capitalization: $4.7 million
Trading Volume: $187 million
WalletConnect (WCT)
Major Bias: Bearish
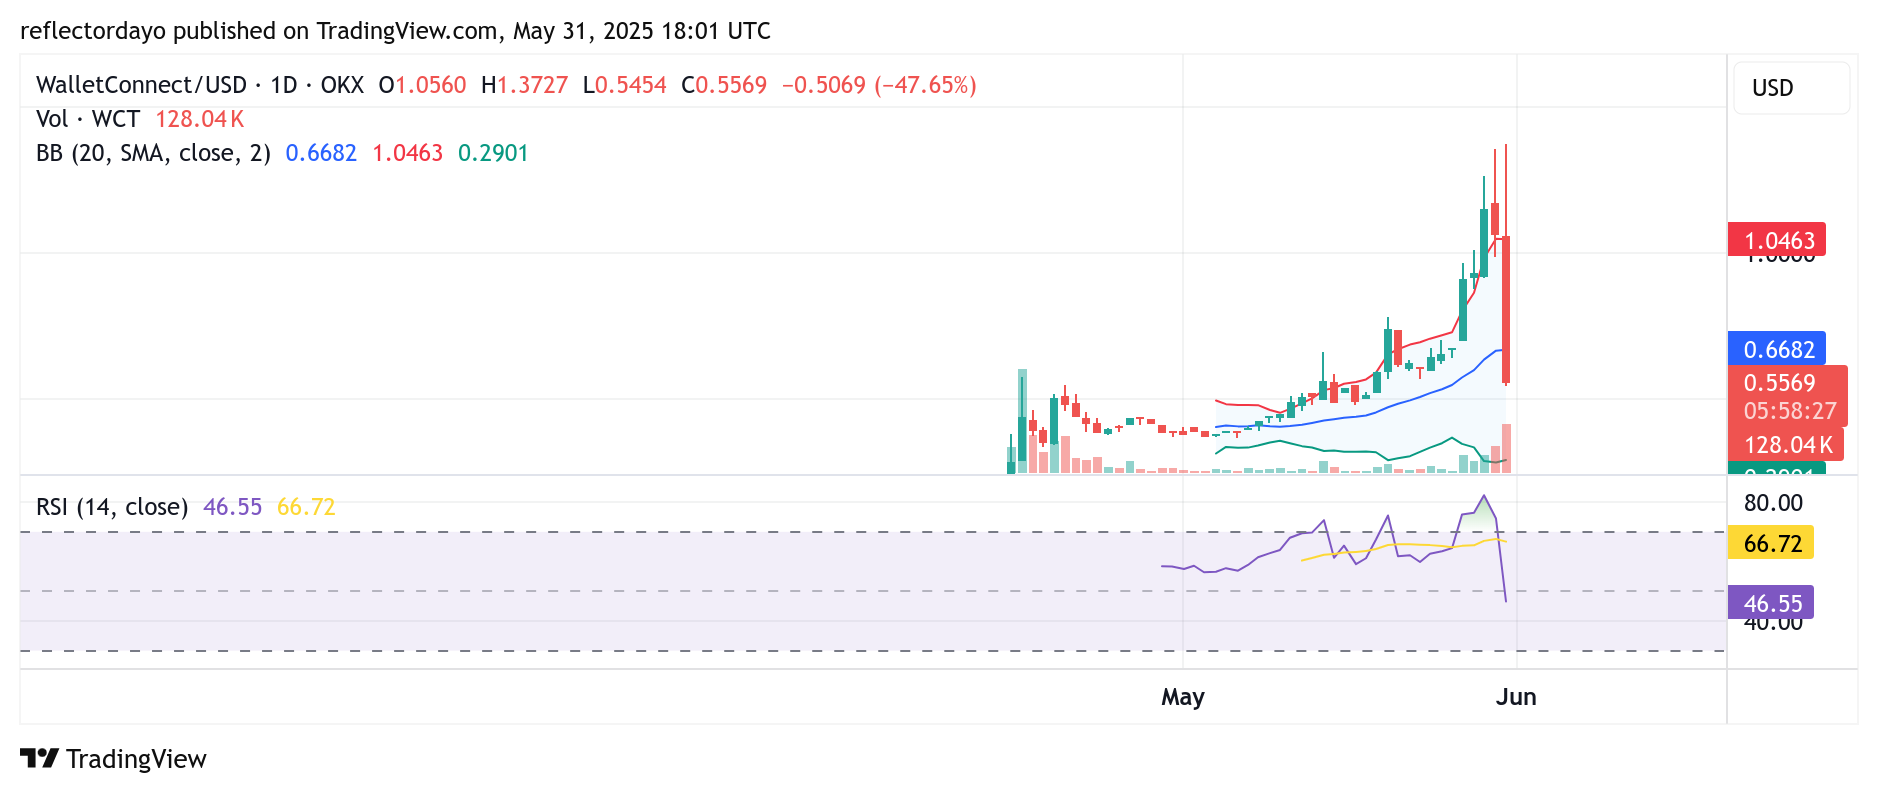
Trailing closely behind is the WalletConnect (WCT) market, which has recently demonstrated a remarkable price surge followed by a significant wave of profit-taking. The heightened volatility surrounding WCT can be attributed to a combination of rapid price appreciation, technically overbought conditions, and increased token flows to exchanges.
In May 2025, WCT witnessed an impressive rally, rising from approximately $0.28 at its April launch to a record high of around $1.34 by May 31—marking a gain of over 370% in just a few weeks. This sharp upward movement triggered overbought signals on several technical indicators, with the Relative Strength Index (RSI) reaching 78 on May 28, clearly indicating that the asset had entered overheated territory.
As a relatively new entrant in the market, WCT remains highly susceptible to speculative trading behavior. The surge in market activity may also be tied to new exchange listings, which typically attract short-term investor interest and fuel rapid price movements.
Current Price: $0.56
Market Capitalization: $105 million
Trading Volume: $1.6 billion
dogwifhat (WIF)
Major Bias: Bearish
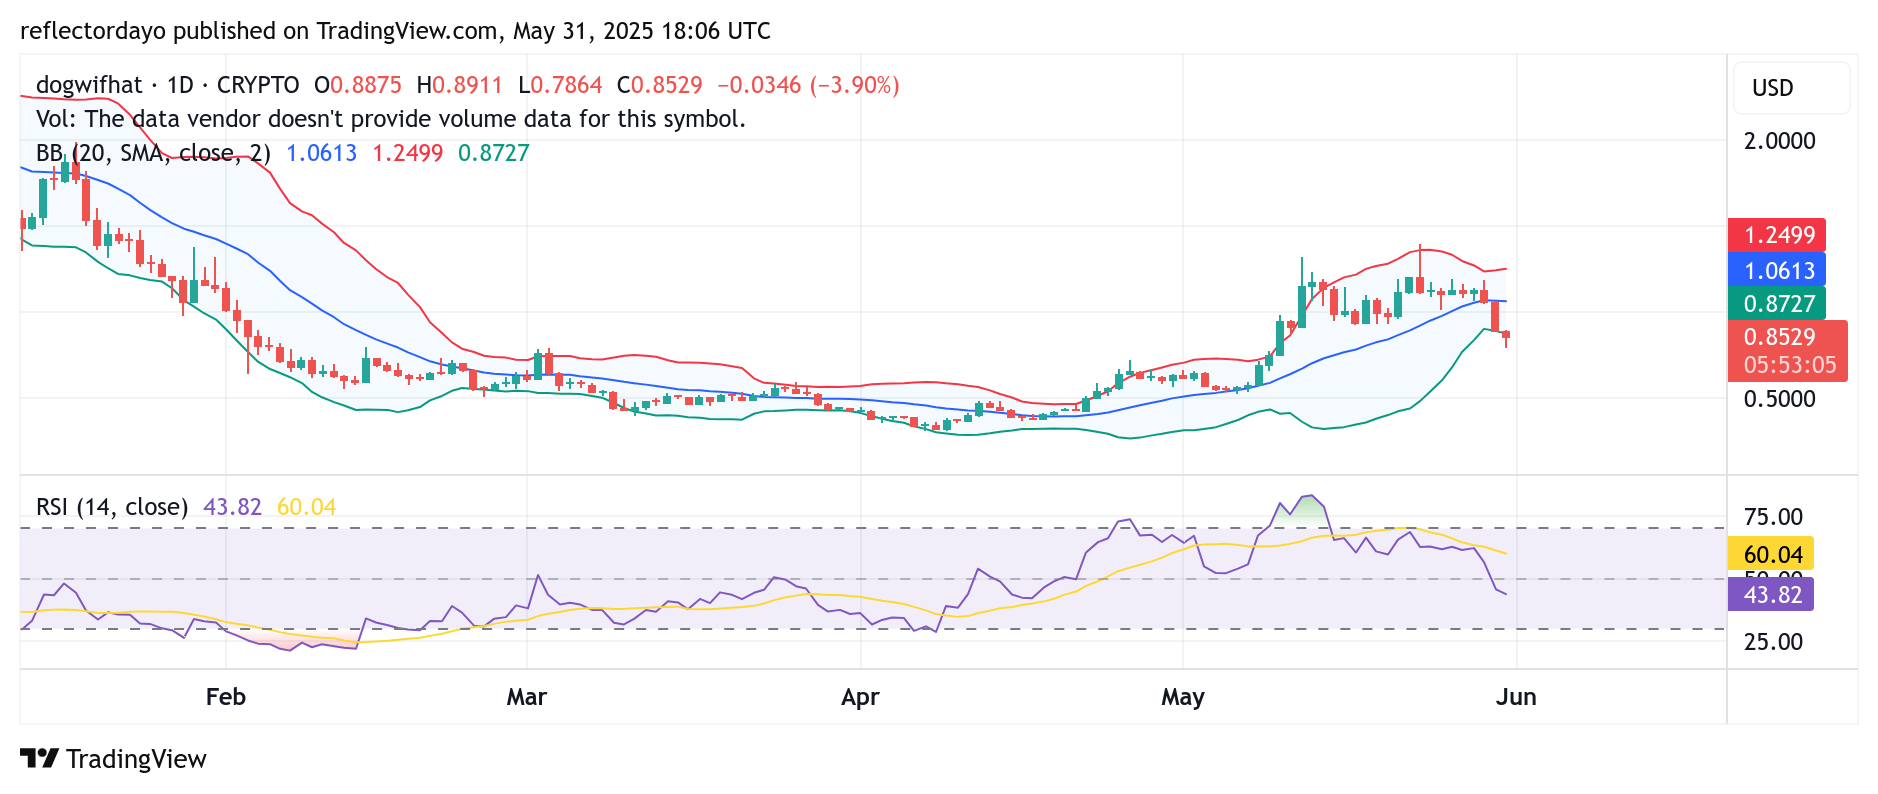
The Dogwifhat (WIF) market recently experienced a breakdown from around the $1.10 level, slipping below the psychologically significant $1.00 support zone. This move triggered an increase in bearish sentiment, pushing the price further downward until buying interest began to emerge near the $0.80 threshold.
Optimistic traders have started taking advantage of the price dip, positioning themselves in anticipation of a potential rebound. However, given the strength of the prior bearish move, the $1.00 level—previously a key support—may now act as a significant resistance point, potentially hindering the recovery momentum as the market attempts to rally.
Current Price: $0.8
Market Capitalization: $855 million
Trading Volume: $487 million

SOLV Protocol

Major Bias: Indecision
Occupying the fourth position in market performance is the SOLV Protocol. Notably, it has been the quickest to recover following a sharp price dip that briefly pushed the token down to the $0.028 level. Strong buying pressure emerged shortly after, driving the price back up to its previous range around $0.043.
Following the initial bullish rebound, SOLV broke above the $0.040 mark and has since been consolidating above this level. The swift recovery highlights the resilience of bullish sentiment in the market.
At the same time, bears have attempted to retest lower levels—particularly the $0.030 zone, which previously served as key support. However, their inability to sustain momentum below the $0.040 level suggests that bearish pressure is weakening, reinforcing the current bullish stance.
Current Price: $0.043
Market Capitalization: $63 million
Trading Volume: $163 million
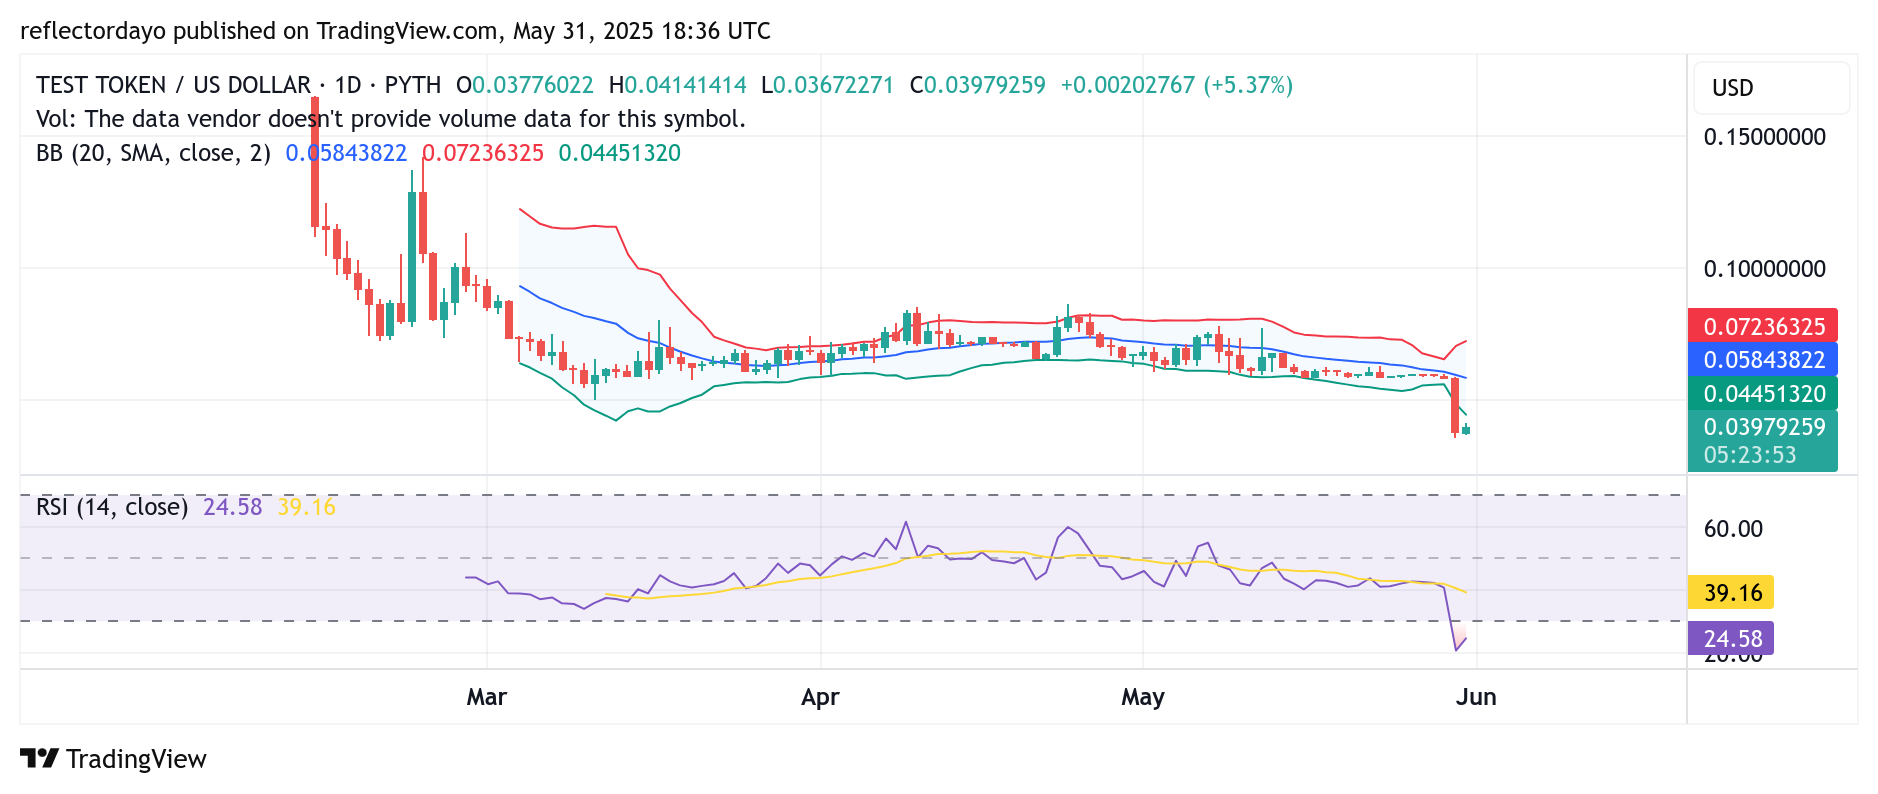
Test (TST)
Major Bias: Bearish
For several months, the price of TEST has been locked in a consolidation phase, trading sideways around the $0.06 level—a pattern that has persisted since approximately March. This range-bound behavior intensified in May, with the price flattening out significantly, suggesting the buildup to a decisive breakout.
Despite the prolonged standoff between bulls and bears, recent price action began to tilt slightly in favor of the bears. This subtle shift culminated in a breakdown below the consolidation range, which is evident in today’s market activity.
Although buyers have started to step in around the $0.036 level—triggering a modest rebound—the recovery thus far appears relatively weak when viewed on the chart. However, the Relative Strength Index (RSI) is now positioned below the 30 mark, indicating oversold conditions. This crypto signal suggests that a technical correction or potential bullish reversal may soon unfold as the market seeks to reestablish equilibrium.
Current Price: $0.039
Market Capitalization: $37 million
Trading Volume: $142 million