Shiba Inu (SHIBUSD) Anticipates a Potential Bearish Trend
Estimated Reading Time: 3 minutes
Don’t invest unless you’re prepared to lose all the money you invest. This is a high-risk investment and you are unlikely to be protected if something goes wrong. Take 2 minutes to learn more

Price Analysis: SHIBUSD Price Action forms a Symmetrical Triangle as Price Points Towards a Potential Bearish Breakout
Since April 2024, SHIBUSD has been in a prolonged bearish trend, characterized by a series of lower lows and lower highs. Despite this, the price experienced a shift in momentum in August, followed by a strong bullish impulse in September. This rally increased the price to the significant resistance level of $0.00002010, with a brief breach before bearish pressure resumed. Following this peak, SHIBUSD declined to the $0.00001560 demand level, which has now become a key support zone.
SHIBA INU Key Levels
Demand Levels: $0.00001560, $0.00001250
Supply Levels: $0.00002010, $0.00002320
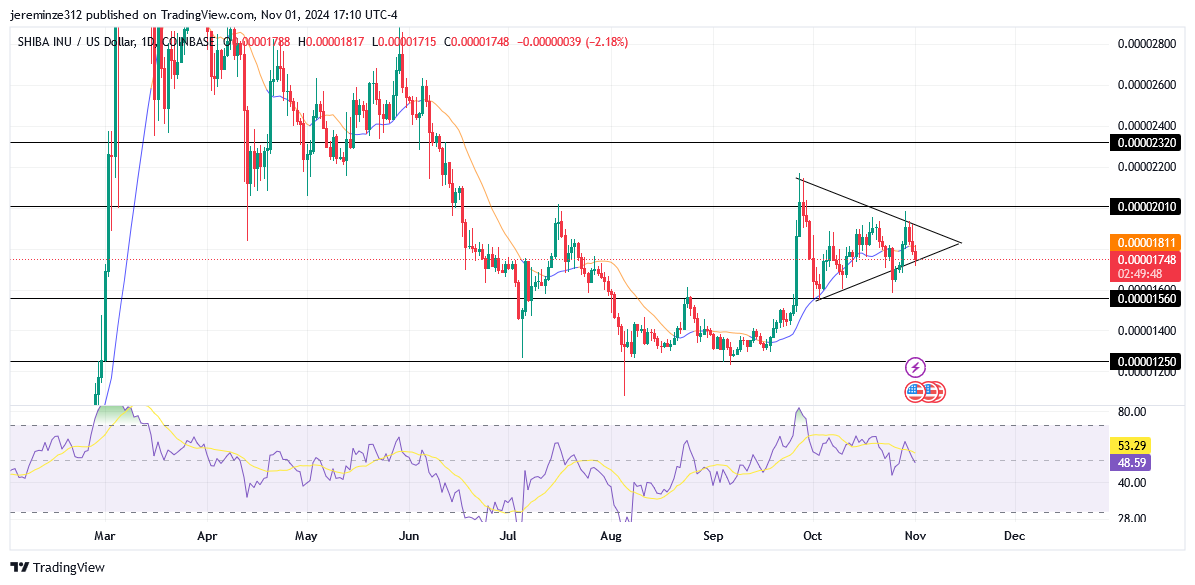
After this price retracement, a symmetrical triangle pattern began forming, with price consolidating within the triangle boundaries. In technical analysis, a symmetrical triangle often signals a potential breakout in either direction, depending on market sentiment. However, in this case, indicators suggest a likely bearish breakout, reinforcing the possibility of continued downside pressure.
Key factors supporting a bearish breakout include signals from the Relative Strength Index (RSI). During the daily timeframe, the RSI has recently exited the overbought zone, indicating a waning buying strength. This movement reflects the beginning of a decline in bullish momentum, which aligns with the price’s descent back toward lower support levels.
On the 4-hour timeframe, the price remains within the confines of the symmetrical triangle, with the RSI trending downward toward the oversold region. This RSI behavior suggests mounting selling pressure and an increase in bearish momentum within the shorter timeframe, indicating that a break below the triangle pattern could act as a confirmation signal for continued downside.

Market Expectation
while the price remains within the triangle pattern, a bearish breakout would reinforce the larger downtrend, potentially signaling further price declines. A confirmed breakout below the triangle pattern would likely re-establish the earlier bearish trend observed since April, with downside targets potentially revisiting previous lows near the $0.00001560 level or lower.
You can purchase Lucky Block here. Buy LBLOCK
Note: Cryptosignals.org is not a financial advisor. Do your research before investing your funds in any financial asset or presented product or event. We are not responsible for your investing results.