$SPONGE (SPONGE/USD) Price Under Pressure, Support Remains Firm
Estimated Reading Time: 2 minutes
Don’t invest unless you’re prepared to lose all the money you invest. This is a high-risk investment and you are unlikely to be protected if something goes wrong. Take 2 minutes to learn more

The $SPONGE bulls have shown remarkable resilience, as evidenced by the continued strength of the key support level at $0.00002. Despite increasing bearish pressure, this support level has remained steadfast.
While the resistance level has been gradually declining from $0.00004 to $0.000035 and now to $0.000033, the underlying bullish sentiment remains evident in the market’s ability to hold onto the $0.00002 support.
Key Market Dynamics:
- Resistance Levels: $0.0010, $0.0011, $0.0012
- Support Levels: $0.000020, $0.0000195, $0.000019
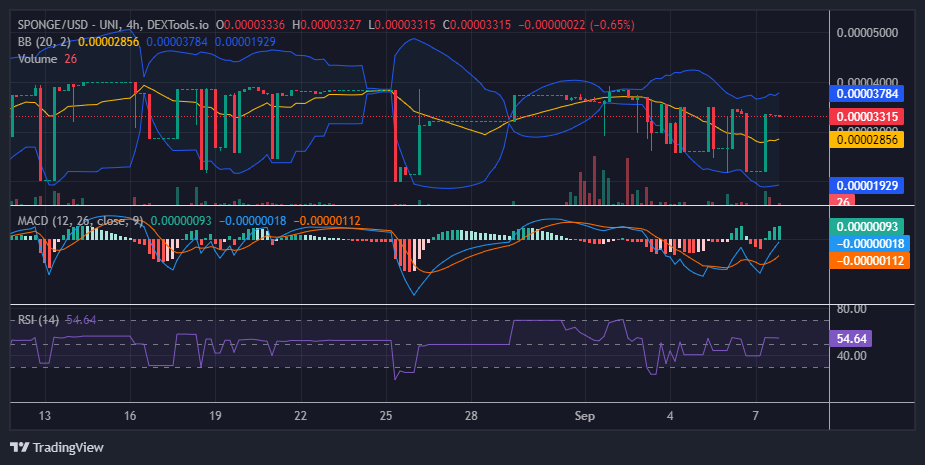
$SPONGE (SPONGE/USD) Technical Outlook
The price action has been consolidating near the $0.000033 level for approximately four sessions. Despite this sideways movement, the Moving Average Convergence Divergence (MACD) indicator is exhibiting a positive crypto signal. The faster EMA has crossed above the slower EMA, and the divergence between the two curves is clearly visible in the MACD histogram.
However, the persistence of the crypto signal in hovering around $0.00003 suggests underlying bullish sentiment is being met with significant bearish resistance. Additionally, the Bollinger Bands indicate that market volatility remains elevated.
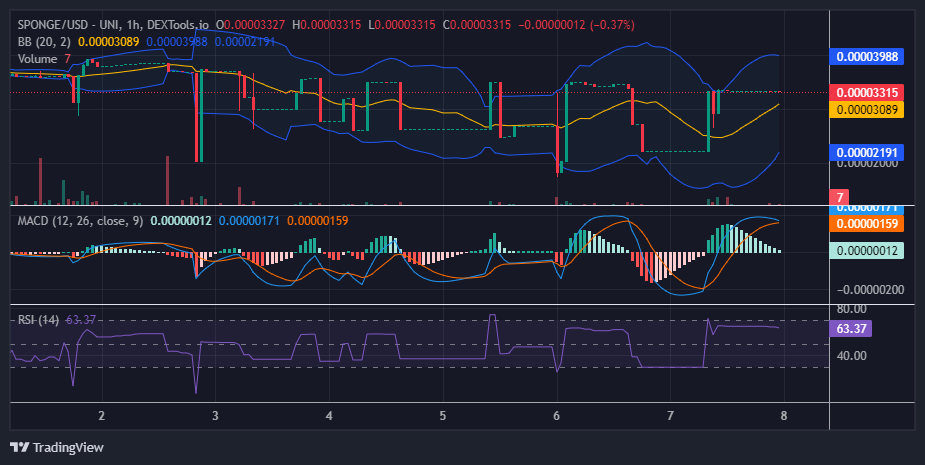
SPONGE/USD 1-Hour Chart Insights
In our previous analysis, we highlighted the price action’s oscillation between $0.00002 and $0.00004. However, we now observe a pattern of lower highs while the support level remains intact.
Investors’ reluctance to push the price above $0.00004 can be attributed to consistent resistance at this level, prompting short-term traders to quickly take profits.
While this price action might be disconcerting, traders should not be overly alarmed. The Bollinger Bands indicate continued volatility, suggesting that bullish forces may still be strong at lower price levels.
Absorb the damp!
#MemeCoin season incoming… 🧽 pic.twitter.com/IQ0JAXO2cO
— $SPONGE (@spongeoneth) September 6, 2024
Join the SPONGE community and be part of the next big crypto sensation! Buy Sponge ($SPONGE) today!


