POL (prev. MATIC) Price Prediction: POL/USDT Upside Correction Toward $0.3000 May Have Failed
Estimated Reading Time: 3 minutes
Don’t invest unless you’re prepared to lose all the money you invest. This is a high-risk investment and you are unlikely to be protected if something goes wrong. Take 2 minutes to learn more

Date: September 12, 2025
The POL (prev. MATIC) market has been attempting to reach the $0.3000 price level for some time now. However, this upside move seems to have failed, as price action has retreated below a key technical level. In addition, bearish activity appears to have gained the upper hand in the ongoing session and may trigger further bearish retracement.
POL/USDT Long-Term Trend—Bearish (Daily Chart)
Key Price Levels:
Resistance: $0.3000, $0.3250, $0.3500
Support: $0.2500, $0.2250, $0.2000
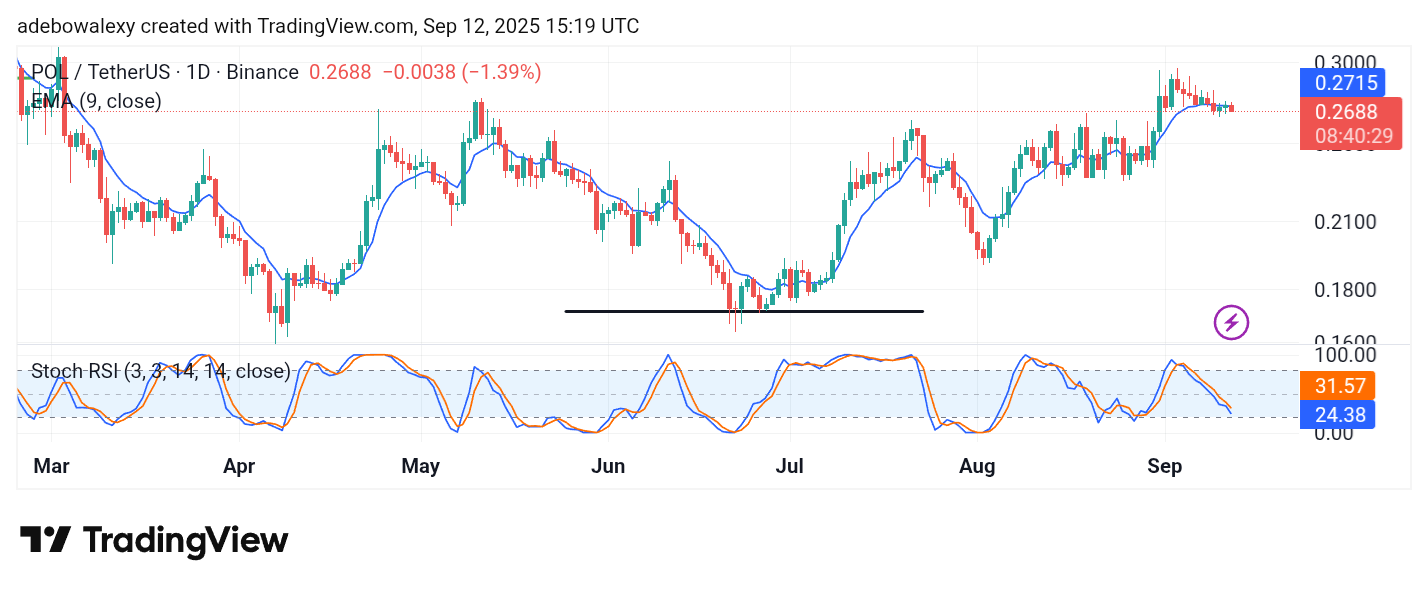
Price action in the POL (prev. MATIC) market has been sliding to lower levels for the past nine sessions. Currently, the last price candle on the chart has fallen below the 9-day Exponential Moving Average (EMA) line. Furthermore, the latest candle, which corresponds to the ongoing session, has appeared bearish and remains below the 9-day EMA curve. The Stochastic Relative Strength Index (SRSI) lines have fallen below the 50 level and continue to maintain a downward trajectory.
POL/USDT Price Prediction: POL (prev. MATIC) Prepares for Further Decline
Indications from the applied technical indicators lean more toward bearishness. For the past three sessions, POL’s price activity has stayed below the 9-day EMA curve.
Moreover, the most recent price candle on the chart suggests that bears have gained a notable grip on the market, which could push the token lower.
At the same time, the SRSI lines have descended into the oversold region. A closer look at the indicator’s terminal shows that downward forces remain strong as the lines diverge and advance deeper into the oversold zone.
POL/USDT Price Prediction: POL (prev. MATIC) Shows Bearish Consistency (4-Hour Chart)
Even on the POL 4-hour chart, bearish activity persists. The latest price candle also remains submerged below the 9-day EMA curve. The last red candle stands out as it drags the market further beneath the EMA line.
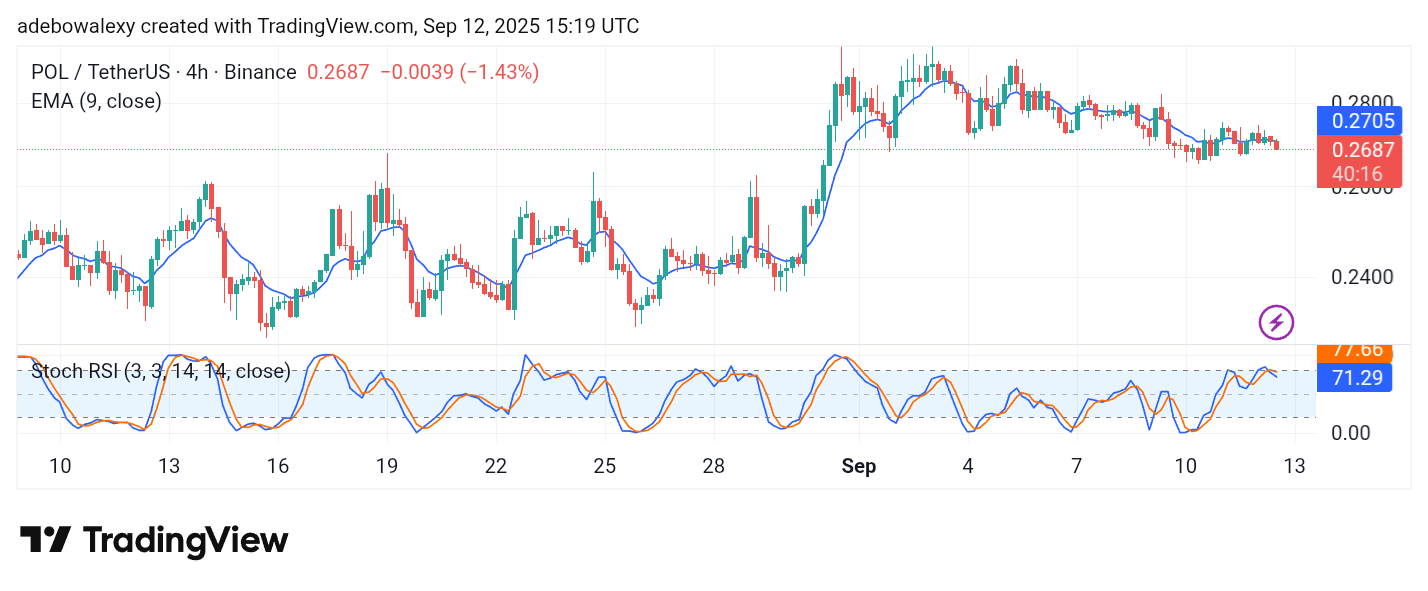
The SRSI indicator curve has made a U-turn from the 80 level, and the lines are now descending toward the 70 threshold. Consequently, this signals that bears are likely to gain more momentum in the coming sessions. At this point, sellers may attempt to push the price toward the $0.2500 support level.